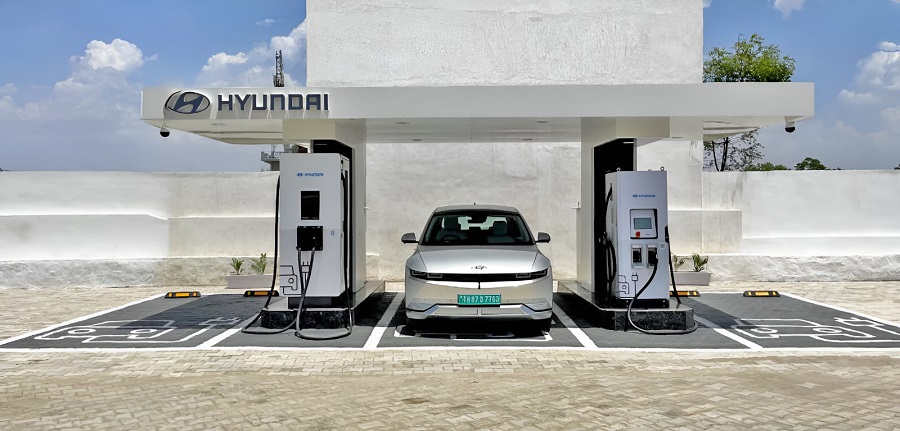
In a landmark shift towards sustainable mobility, Delhi has emerged as a frontrunner in India’s electric vehicle (EV) revolution, recording a 7.72% share of EVs in total vehicle sales. With over 2,16,084 EVs sold in the capital, the city has set a benchmark for other states to follow in adopting cleaner and greener transportation options.
Government Schemes Pave the Way
The Ministry of Heavy Industries has implemented several flagship initiatives to bolster India’s indigenous EV ecosystem, boost manufacturing capabilities, and promote exports. These include:
- FAME India Scheme Phase-II
Launched in April 2019 with a budget of ₹11,500 crore, this initiative incentivizes electric two-wheelers, three-wheelers, four-wheelers, e-buses, and public charging infrastructure. - Production Linked Incentive (PLI) Scheme for AAT Products
Rolled out in September 2021 with a ₹25,938 crore outlay, this scheme enhances domestic manufacturing of Advanced Automotive Technology products, requiring at least 50% Domestic Value Addition (DVA). - PLI for Advanced Chemistry Cell (ACC)
Approved in May 2021 with a budget of ₹18,100 crore, this scheme focuses on creating a competitive ecosystem for manufacturing 50 GWh of ACC batteries. - PM Electric Drive Revolution in Innovative Vehicle Enhancement (PM E-DRIVE)
Introduced in September 2024 with ₹10,900 crore, PM E-DRIVE supports various EV categories, from two-wheelers to ambulances, and funds upgrades for vehicle testing agencies. - PM e-Bus Sewa-Payment Security Mechanism (PSM)
With an allocation of ₹3,435.33 crore, this October 2024 scheme supports the deployment of over 38,000 electric buses, providing payment security to e-bus operators. - Scheme for Promotion of Manufacturing of Electric Passenger Cars in India (SPMEPCI)
This March 2024 initiative aims to attract investments of ₹4,150 crore, requiring a minimum DVA of 50% by its fifth year.
Global Resource Collaboration
To secure critical minerals for EV production, India has intensified international collaborations. The Ministry of Mines has established Khanij Bidesh India Limited (KABIL), a joint venture involving NALCO, HCL, and MECL. KABIL has already partnered with Argentina’s CAMYEN for lithium exploration and is in talks with Australia’s Critical Mineral Office for further acquisitions.
India’s EV Future
With these strategic initiatives, India is positioning itself as a global EV powerhouse. As Delhi leads the charge, the rest of the nation is gearing up to accelerate its transition to sustainable transportation. The government’s comprehensive policy support and growing public awareness promise a bright future for India’s EV landscape.
Minister’s Insight
Highlighting these achievements, Minister of State for Heavy Industries and Steel, Bhupathiraju Srinivasa Varma, emphasized India’s commitment to green mobility and its ambition to become a global EV hub.
India’s journey towards electrification is well underway, and with cities like Delhi leading the way, the dream of an eco-friendly transportation future feels closer than ever.
State-wise data of the total number of Electric Vehicles (EVs) registered as percentage of the total number of vehicles registered during 01/04/2019 till 31/03/2024–
| Sl. No. | State/ UT | Total EV | Total Vehicles Sold | % Share of EV in Total Vehicles Sold |
| 1 | UTTAR PRADESH | 6,65,247 | 1,53,17,699 | 4.34% |
| 2 | MAHARASHTRA | 4,39,358 | 1,10,55,082 | 3.97% |
| 3 | KARNATAKA | 3,50,810 | 73,15,250 | 4.80% |
| 4 | TAMIL NADU | 2,28,850 | 84,76,042 | 2.70% |
| 5 | RAJASTHAN | 2,33,503 | 64,90,725 | 3.60% |
| 6 | BIHAR | 2,14,921 | 57,63,437 | 3.73% |
| 7 | DELHI | 2,16,084 | 27,99,571 | 7.72% |
| 8 | GUJARAT | 1,91,185 | 74,50,473 | 2.57% |
| 9 | MADHYA PRADESH | 1,44,782 | 68,12,437 | 2.13% |
| 10 | KERALA | 1,51,029 | 37,81,393 | 3.99% |
| 11 | ASSAM | 1,50,617 | 25,99,986 | 5.79% |
| 12 | ODISHA | 97,056 | 33,55,237 | 2.89% |
| 13 | ANDHRA PRADESH | 88,534 | 47,72,995 | 1.85% |
| 14 | CHHATTISGARH | 80,348 | 26,56,935 | 3.02% |
| 15 | HARYANA | 81,775 | 37,03,954 | 2.21% |
| 16 | WEST BENGAL | 69,220 | 50,99,551 | 1.36% |
| 17 | PUNJAB | 56,459 | 29,73,281 | 1.90% |
| 18 | JHARKHAND | 47,400 | 25,45,053 | 1.86% |
| 19 | UTTARAKHAND | 48,522 | 11,20,010 | 4.33% |
| 20 | JAMMU & KASHMIR | 19,099 | 8,23,164 | 2.32% |
| 21 | GOA | 20,330 | 3,23,748 | 6.28% |
| 22 | TRIPURA | 20,113 | 2,64,004 | 7.62% |
| 23 | CHANDIGARH | 12,375 | 2,19,391 | 5.64% |
| 24 | PUDUCHERRY | 5,933 | 2,52,488 | 2.35% |
| 25 | HIMACHAL PRADESH | 3,043 | 6,36,556 | 0.48% |
| 26 | MANIPUR | 1,273 | 1,68,310 | 0.76% |
| 27 | MEGHALAYA | 572 | 1,62,249 | 0.35% |
| 28 | MIZORAM | 344 | 1,36,845 | 0.25% |
| 29 | UT OF DNH AND DD | 468 | 90,571 | 0.52% |
| 30 | ANDAMAN & NICOBAR ISLAND | 191 | 35,896 | 0.53% |
| 31 | LADAKH | 88 | 19,645 | 0.45% |
| 32 | ARUNACHAL PRADESH | 42 | 1,37,145 | 0.03% |
| 33 | NAGALAND | 27 | 1,19,281 | 0.02% |
| 34 | LAKSHADWEEP | 19 | 2,752 | 0.69% |
| 35 | SIKKIM | – | 49,884 | 0.00% |
| Total for above | 36,39,617 | 10,75,31,040 | 3.38% |


