
Mumbai: Mahindra & Mahindra has wrapped up FY26 with a performance that could make even its rugged SUVs blush. The company reported a consolidated Profit After Tax (PAT) of ₹17,099 crore, marking a robust 35% growth year-on-year, while Q4 alone delivered a 42% jump to ₹4,668 crore. Adding a cherry on top, the Board has approved a dividend of ₹33 per share—up 30%, because apparently, good news prefers company.
The homegrown auto giant’s consolidated revenue surged to ₹1,98,639 crore in FY26, up 25%, driven by strong execution across its auto, farm, and services businesses. Return on Equity stood at an impressive 20.1%, while earnings per share climbed to ₹152.2—numbers that suggest the company didn’t just weather global uncertainties, it took them for a spin.
SUVs, Tractors, and a Firm Grip on Leadership
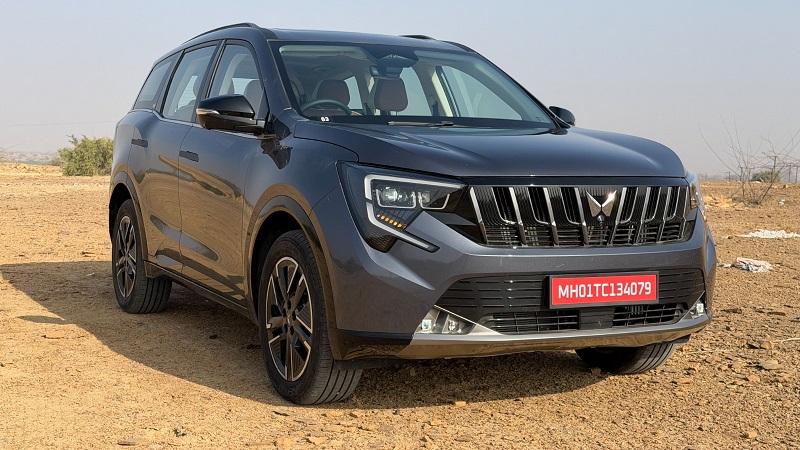
Mahindra tightened its grip on key segments, maintaining its position as India’s No. 1 SUV player with a 25.3% revenue market share, up 260 basis points. In the Light Commercial Vehicle (LCV) segment under 3.5 tonnes, it continued its dominance with a 52.3% share, while tractors remained another stronghold at 43.6%.
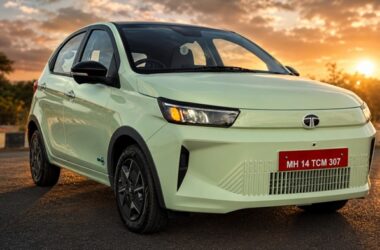
Electric mobility wasn’t left behind either. The company retained leadership in electric three-wheelers with a commanding 40% market share—quietly electrifying the streets while the rest debated range anxiety.
Auto Business: Accelerating Ahead
The Auto division delivered strong momentum with Q4 volumes reaching 307,000 units, up 21%, while utility vehicle volumes stood at 184,000 units. For the full year, volumes grew 19%, with SUVs alone rising 20%.
Standalone Q4 profits before interest and tax (PBIT) rose 28% to ₹2,955 crore, while margins improved to 9.5%. Excluding electric SUV contract manufacturing, margins touched 10.9%, signaling healthier core operations.
Farm Segment: Harvesting Growth
Mahindra’s farm equipment business had a bumper year, with Q4 volumes surging 36% to 120,000 units. Market share climbed to 42.1% in the quarter, reinforcing its leadership in tractors.
Standalone FY26 PBIT grew 35% to ₹7,206 crore, with margins nearing 20%. Notably, the company also exited three international farm markets, aligning with its disciplined capital allocation strategy—proof that sometimes, growth means knowing where not to grow.
Services: The Silent Performer
The services segment emerged as a strong contributor, with FY26 revenue rising 17% to ₹43,698 crore and PAT jumping 54% to ₹4,960 crore.
Tech Mahindra reported improved EBIT margins at 12.6%, up 290 basis points, supported by new deal wins. Meanwhile, Mahindra Finance saw its Assets Under Management grow 12%, with stable asset quality.
Other “Growth Gems”—including real estate, logistics, and Accelo—posted an impressive 50% PAT growth, quietly becoming the group’s not-so-hidden treasures.
Leadership Speaks
Dr. Anish Shah, Group CEO & Managing Director, described FY26 as a “defining year,” highlighting strong execution despite geopolitical disruptions. He emphasized that the group is well-positioned to accelerate further, even in uncertain times.
Rajesh Jejurikar noted that SUV market share gains and record tractor billing of over 5 lakh units underscore the company’s operational strength.
Group CFO Amarjyoti Barua added that strong cash generation has reinforced the balance sheet, enabling future growth investments—along with that generous dividend hike.
The Road Ahead
With leadership across SUVs, tractors, LCVs, and electric three-wheelers, Mahindra’s FY26 performance reads less like a quarterly update and more like a highlight reel. If this trajectory continues, competitors might need more than horsepower—they may need a miracle.
Or, at the very least, a Mahindra.
Key financials:
| Rs cr. | Q4 F26 | Q4 F25 | Growth% YoY | F26 | F25 | Growth% YoY |
| Consolidated Results | ||||||
| Revenue | 54,982 | 42,599 | 29% | 198,639 | 159,211 | 25% |
| PAT | 4,668 | 3,295 | 42% | 17,099 | 12,929 | 32%# |
#35% Excluding F25 gains of 304 cr. on land sale
PAT is PAT after Non-Controlling Interest
Summary of standalone financials:
Rs cr.
| Q4 F26 | Q4 F25 | Growth% YoY | F26 | F25 | Growth% YoY | |
| Standalone Results | ||||||
| Revenue | 39,601 | 31,609 | 25% | 1,47,765 | 1,18,625 | 25% |
| EBITDA | 5,509 | 4,219 | 31% | 22,490 | 18,416 | 22% |
| PAT | 3,737 | 2,437 | 53% | 15,639 | 11,855 | 32% |
| Volumes | ||||||
| Total Vehicles sold | 3,06,508^ | 2,53,028^ | 21% | 11,17,698^ | 9,41,115^ | 19% |
| Total Tractors sold | 1,19,811 | 88,018 | 36% | 5,26,403 | 4,24,641 | 24% |
# Includes 36,877 in Q4 F26.,27,990 in Q4 F25., 1,36,855 in F26., 1,08,661 in F25 volume sold by LMM. Includes 16,638 in Q4 F26., 8,048 in Q4 F25., 51,820 in F26 & 8,048 in F25 BEVs sold by MEAL.