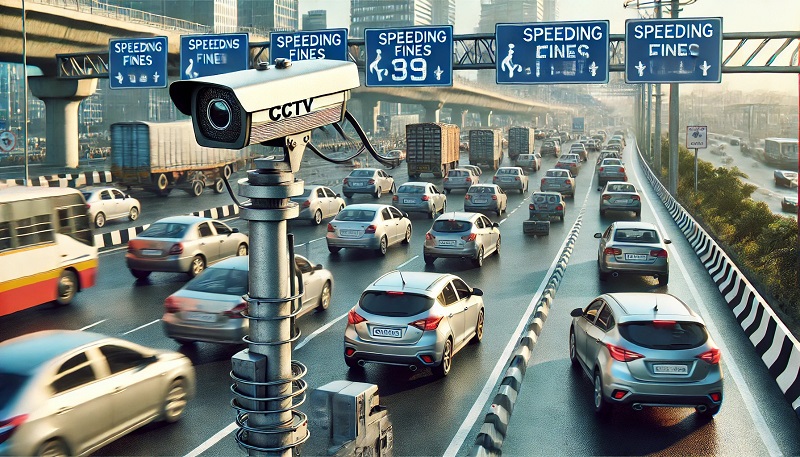
Tamil Nadu has emerged as the state with the highest number of e-Challans issued in India, reflecting its robust implementation of motor vehicle regulations and increasing adoption of digital enforcement mechanisms. The data highlights a growing focus on road safety and compliance with the Central Motor Vehicles Rules, 1989.

Speed Limit Governance and Vehicle Compliance
Under Rule 118 of the Central Motor Vehicles Rules, 1989, transport vehicles manufactured on or after October 1, 2015, are required to be equipped with speed governors, limiting their maximum speed to 80 km/h. Exemptions include two-wheelers, three-wheelers, ambulances, fire tenders, and police vehicles. As of November 30, 2024, 10.7 lakh transport vehicles out of 2.18 crore are fitted with Speed Limiting Devices (SLDs), highlighting a significant push towards speed regulation.
Motor Vehicle and License Landscape
India’s motor vehicle ecosystem is vast and diverse. According to the National Register of Motor Vehicles (Vahan 4.0), there are approximately 38.51 crore registered motor vehicles nationwide. Meanwhile, the National Register of Driving Licenses (Sarathi 4.0) records 18.20 crore valid driving licenses and 95.79 lakh learner licenses.
Interestingly, multiple classes of vehicles can be linked to a single license, and individuals or entities can own multiple vehicles, making compliance monitoring more complex.
Insurance and Pollution Compliance
Data from the Insurance Information Bureau (IIB) reveals that 17.54 crore motor vehicles are insured, underscoring the need for greater insurance penetration. Additionally, only 5.34 crore vehicles possess valid Pollution Under Control Certificates (PUCC). Notably, vehicles less than a year old and electric or non-self-propelled vehicles are exempt from PUCC requirements, as per the Central Motor Vehicles Rules, 1989.
Enforcement Responsibility
While the Central Government frames regulations under the Motor Vehicles Act, 1988, the enforcement lies with individual states and union territories. Tamil Nadu’s leading position in e-Challans signals its proactive measures in enforcing compliance and leveraging digital tools for monitoring traffic violations.
A Broader Perspective on Road Safety
With rising numbers of vehicles and licenses, India faces the dual challenge of ensuring road safety and environmental sustainability. Tamil Nadu’s leadership in e-Challan issuance highlights the state’s commitment to addressing these challenges through stringent enforcement and public awareness.
This development serves as a reminder of the crucial role of state authorities in fostering a culture of compliance, ensuring safer roads, and building an environmentally responsible motor vehicle ecosystem.
According to data from the e-Challan portal, the state-wise statistics for the number of e-Challans issued and the corresponding revenue generated by the States and Union Territories over the five-year period from January 1, 2019, to December 31, 2023, are provided below. It is important to note that this data excludes the states of Telangana, Arunachal Pradesh, Nagaland, and the Union Territories of Lakshadweep and Andaman & Nicobar, where the e-Challan system was not implemented during the mentioned period.
| S.No. | State/Union Territory | Number of challanissued | Revenue collection (in Rupees) |
| 1. | Tamil Nadu | 5,57,62,916 | 7,55,58,16,274 |
| 2. | Uttar Pradesh | 4,40,03,150 | 24,95,18,72,926 |
| 3. | Kerala | 1,88,35,738 | 6,90,92,02,912 |
| 4. | Haryana | 1,03,90,665 | 14,65,17,51,846 |
| 5. | Delhi | 90,22,711 | 5,71,43,38,802 |
| S.No. | State/Union Territory | Number ofchallan issued | Revenue collection (in Rupees) |
| 6. | Rajasthan | 58,55,678 | 13,93,47,99,915 |
| 7. | Odisha | 54,11,511 | 5,00,06,47,690 |
| 8. | Bihar | 43,41,219 | 14,03,85,98,368 |
| 9. | Himachal Pradesh | 36,06,736 | 3,81,74,53,286 |
| 10. | West Bengal | 33,44,857 | 3,18,46,88,520 |
| 11. | Gujarat | 33,31,209 | 6,80,31,93,071 |
| 12. | Maharashtra | 30,91,878 | 9,44,11,27,057 |
| 13. | Goa | 25,86,910 | 78,30,56,228 |
| 14. | Chandigarh | 22,90,051 | 1,49,99,55,378 |
| 15. | Madhya Pradesh | 20,19,408 | 69,21,38,896 |
| 16. | Assam | 18,08,274 | 3,51,13,99,862 |
| 17. | Jammu & Kashmir | 17,62,845 | 50,38,34,565 |
| 18. | Uttarakhand | 14,30,163 | 1,65,34,12,974 |
| 19. | Tripura | 8,24,362 | 26,80,74,243 |
| 20. | Jharkhand | 6,71,941 | 50,07,44,416 |
| 21. | Chhattisgarh | 4,93,068 | 33,79,34,672 |
| 22. | Punjab | 4,07,691 | 31,53,48,085 |
| 23. | Andhra Pradesh | 3,87,676 | 77,49,215 |
| 24. | Pondicherry | 2,90,868 | 6,29,94,200 |
| 25. | Karnataka | 2,79,957 | 5,28,61,700 |
| 26. | Meghalaya | 70,531 | 6,58,82,600 |
| 27. | Dadra and Nagar Haveli & Daman andDiu | 57,985 | 3,51,64,187 |
| 28. | Mizoram | 15,709 | 1,38,12,800 |
| 29. | Manipur | 7,128 | 4,25,99,12 |
| 30. | Sikkim | 1,564 | 73,03,090 |
| 31. | Ladakh | 651 | 2,96,625 |
| TOTAL | 18,24,05,050 | 1,26,31,97,14,315 | |


