New Delhi — The Federation of Automobile Dealers Associations (FADA) today released its January’25 Vehicle Retail Data, painting an encouraging picture of the auto retail sector’s performance as the new year gets underway. The data reveals a 6.6% year-on-year (YoY) growth in overall auto retail sales, aligning well with earlier projections of a “flat to moderately positive” start for 2025.
Strong Gains Across All Segments
Passenger Vehicles Lead the Charge:
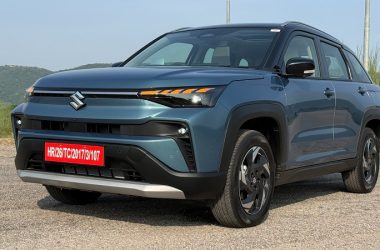
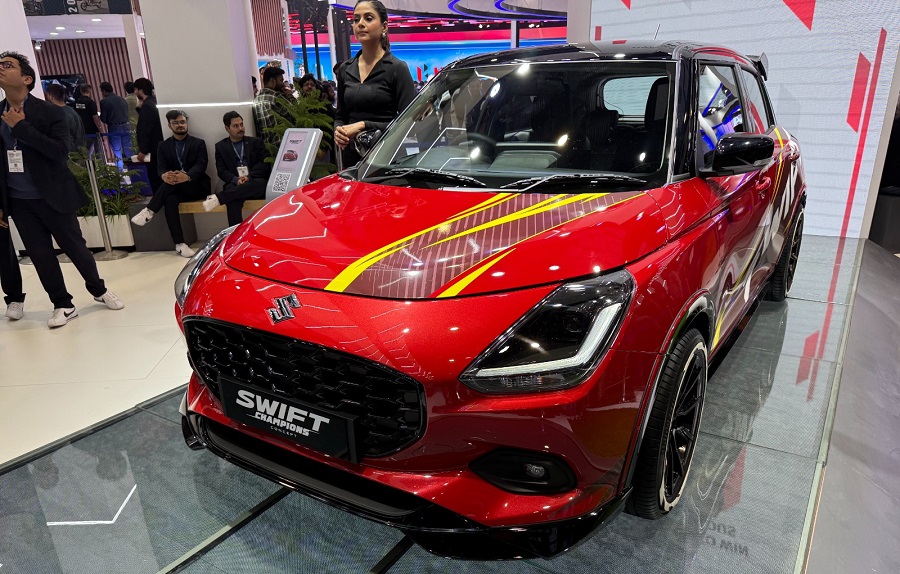
Passenger Vehicle (PV) sales surged by an impressive 15.53% YoY, buoyed by a spillover effect from December’s purchases registering in January to take advantage of the “2025 model year” benefits. Urban markets saw a modest share increase from 60.8% to 61.8%, while rural sales outpaced urban growth with an 18.57% rise compared to 13.72%.
Two-Wheelers and Three-Wheelers:
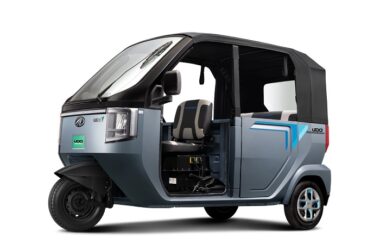
Two-Wheeler (2W) sales experienced a healthy 4.15% YoY increase, supported by new model launches, marriage season demand, and enhanced financing options. Three-Wheelers (3W) also registered a solid performance, growing by 6.8% YoY, even as dealers grapple with challenges like rising interest rates and rural liquidity constraints.
Commercial Vehicles and Tractors:
The Commercial Vehicles (CV) segment notched an 8.22% YoY increase, driven by higher freight rates and sustained demand for passenger carriers. Tractors too saw a positive uptick of 5% YoY. Despite these gains, sectors such as cement, coal, and infrastructure remain subdued, with strict financing policies and weak rural sentiment continuing to present hurdles.
Inventory Trends:
Improvements in inventory levels were noted as the PV segment saw its stock levels drop by approximately five days to a healthier 50–55 days, suggesting a better balance between supply and demand, albeit with a need for ongoing monitoring.
Dealers’ Insights and Market Sentiment
FADA President C S Vigneshwar commented on the sector’s performance:
“The auto retail sector kicked off 2025 on a promising note. Our data confirms the optimism we had projected. All major segments—2W, 3W, PV, Tractor, and CV—demonstrated positive momentum. While new model introductions and seasonal demand have been key drivers, certain challenges such as rising interest rates and liquidity constraints in rural areas continue to temper expectations.”
The sentiment among dealers remains cautiously optimistic. According to the latest survey:
- Liquidity: 51.77% of respondents felt neutral about liquidity, 25.89% rated it as bad, while 22.34% viewed it as good.
- Overall Sentiment: A neutral sentiment was reported by 53.55% of dealers, with 24.47% expressing optimism and 21.99% pessimism.
- February’25 Outlook: Approximately 45.74% of dealers expect growth in February, 42.91% predict flat sales, and 11.35% foresee a dip.
Looking Ahead: Opportunities and Challenges
As February unfolds, the auto retail sector appears poised for modest gains. The ongoing marriage season, continuous product launches, and strategic promotional activities are anticipated to keep customer footfall steady. Additionally, improved financing options from select lenders and a backlog of orders in certain segments, notably commercial vehicles, contribute to a cautiously positive outlook.
However, dealers remain wary of potential impediments:
- Shorter Selling Days & Inflation: With fewer working days in the month and ongoing inflationary pressures, there could be a slowdown in momentum.
- Rural Liquidity Concerns: Persistent liquidity issues and a subdued rural market might restrict overall growth despite promising urban performance.
Conclusion
The January’25 Auto Retail Report by FADA underscores a promising start to 2025, with robust gains across most vehicle categories and improved inventory dynamics. While challenges persist—chief among them rising interest rates, liquidity constraints, and inflation—the industry is cautiously optimistic. With nearly half of the surveyed dealers anticipating growth in February, the auto retail sector is well-positioned to navigate near-term headwinds and build on its early-year success.
Chart showing Vehicle Retail Data for YTD FY’25 and January’25
All India Vehicle Retail Data for YTD FY’25 (April’24 to Jan’25)
| CATEGORY | YTD FY’25 | YTD FY’24 | Growth % |
| 2W | 1,60,01,097 | 1,45,46,886 | 10.00% |
| 3W | 10,27,437 | 9,66,612 | 6.29% |
| CV | 8,30,028 | 8,27,451 | 0.31% |
| PV | 34,76,061 | 32,92,192 | 5.59% |
| TRAC | 7,43,538 | 7,37,262 | 0.85% |
| Total | 2,20,78,161 | 2,03,70,403 | 8.38% |
Source: FADA Research
All India Vehicle Retail Data for January’25
| CATEGORY | Jan’25 | Dec’24 | Jan’24 | MoM% | YoY% |
| 2W | 15,25,862 | 11,97,742 | 14,65,039 | 27.39% | 4.15% |
| 3W | 1,07,033 | 93,892 | 1,00,160 | 14.00% | 6.86% |
| E-RICKSHAW(P) | 38,830 | 40,845 | 40,537 | -4.93% | -4.21% |
| E-RICKSHAW WITH CART (G) | 5,760 | 5,826 | 3,744 | -1.13% | 53.85% |
| THREE-WHEELER (GOODS) | 12,036 | 9,122 | 10,716 | 31.94% | 12.32% |
| THREE-WHEELER (PASSENGER) | 50,322 | 38,031 | 45,113 | 32.32% | 11.55% |
| THREE-WHEELER (PERSONAL) | 85 | 68 | 50 | 25.00% | 70.00% |
| PV | 4,65,920 | 2,93,465 | 4,03,300 | 58.77% | 15.53% |
| TRAC | 93,381 | 99,292 | 88,741 | -5.95% | 5.23% |
| CV | 99,425 | 72,028 | 91,877 | 38.04% | 8.22% |
| LCV | 56,410 | 39,794 | 51,260 | 41.76% | 10.05% |
| MCV | 6,975 | 4,662 | 5,586 | 49.61% | 24.87% |
| HCV | 30,061 | 22,781 | 30,220 | 31.96% | -0.53% |
| Others | 5,979 | 4,791 | 4,811 | 24.80% | 24.28% |
| Total | 22,91,621 | 17,56,419 | 21,49,117 | 30.47% | 6.63% |
Source: FADA Research
All India Vehicle Retail Strength YoY and MOM comparison for Jan’25.
| Category | MoM% | YoY% | Category | MoM% | YoY% |
| 2W | CV | ||||
| Urban | 33.85% | 4.54% | Urban | 41.06% | 9.51% |
| Rural | 22.81% | 3.85% | Rural | 35.00% | 6.89% |
| 3W | TRAC | ||||
| Urban | 25.11% | 5.71% | Urban | -15.99% | -0.84% |
| Rural | 4.78% | 8.03% | Rural | -3.22% | 6.77% |
| PV | Total | ||||
| Urban | 61.30% | 13.72% | Urban | 38.65% | 7.05% |
| Rural | 54.83% | 18.57% | Rural | 24.00% | 6.27% |
Source: FADA Research
All India Vehicle Retail Strength YoY comparison for YTD FY’25 (April’24 to Jan’25).
| Category | YoY% | Category | YoY% |
| 2W | CV | ||
| Urban | 8.49% | Urban | -0.34% |
| Rural | 10.53% | Rural | 0.08% |
| 3W | TRAC | ||
| Urban | 1.46% | Urban | -4.15% |
| Rural | 11.10% | Rural | 2.06% |
| PV | Total | ||
| Urban | 0.67% | Urban | 5.76% |
| Rural | 8.03% | Rural | 9.45% |
Source: FADA Research
Motor Vehicle Road Tax Collection (in Rs Crore) for Jan’25
| Jan’25 | Dec’24 | Jan’24 | MoM% | YoY% | |
| Motor Vehicle Road Tax Collection | 8,603 | 6,230 | 7,709 | 38.1% | 11.6% |
Source: FADA Research
Disclaimer:
- The above numbers do not have figures from TS.
- Vehicle Retail Data has been collated as on 04.02.25 in collaboration with Ministry of Road Transport & Highways, Government of India and has been gathered from 1,375 out of 1,436 RTOs.
- Commercial Vehicle is subdivided in the following manner
- LCV – Light Commercial Vehicle (incl. Passenger & Goods Vehicle)
- MCV – Medium Commercial Vehicle (incl. Passenger & Goods Vehicle)
- HCV – Heavy Commercial Vehicle (incl. Passenger & Goods Vehicle)
- Others – Construction Equipment Vehicles and others
- 3-Wheeler is sub-divided in the following manner
- E-Rickshaw – Passenger
- E-Rickshaw – Goods
- 3-Wheeler – Goods
- 3-Wheeler – Passenger
- 3-Wheeler – Personal
OEM wise Market Share Data for Jan’25 with YoY comparison
| Two-Wheeler OEM | JAN’25 | Market Share (%) JAN’25 | JAN’24 | Market Share (%) JAN’24 |
| HERO MOTOCORP LTD | 4,10,774 | 26.92% | 4,11,318 | 28.08% |
| HONDA MOTORCYCLE AND SCOOTER INDIA (P) LTD | 3,72,982 | 24.44% | 3,58,278 | 24.46% |
| TVS MOTOR COMPANY LTD | 2,87,437 | 18.84% | 2,55,175 | 17.42% |
| BAJAJ AUTO GROUP | 1,73,754 | 11.39% | 1,77,377 | 12.11% |
| BAJAJ AUTO LTD | 1,73,754 | 11.39% | 1,77,376 | 12.11% |
| CHETAK TECHNOLOGY LIMITED | – | 0.00% | 1 | 0.00% |
| SUZUKI MOTORCYCLE INDIA PVT LTD | 88,315 | 5.79% | 75,876 | 5.18% |
| ROYAL-ENFIELD (UNIT OF EICHER LTD) | 76,574 | 5.02% | 67,318 | 4.59% |
| INDIA YAMAHA MOTOR PVT LTD | 58,110 | 3.81% | 57,958 | 3.96% |
| OLA ELECTRIC TECHNOLOGIES PVT LTD | 24,336 | 1.59% | 32,424 | 2.21% |
| ATHER ENERGY PVT LTD | 12,906 | 0.85% | 9,380 | 0.64% |
| GREAVES ELECTRIC MOBILITY PVT LTD | 3,611 | 0.24% | 2,358 | 0.16% |
| PIAGGIO VEHICLES PVT LTD | 2,769 | 0.18% | 3,183 | 0.22% |
| CLASSIC LEGENDS PVT LTD | 2,753 | 0.18% | 2,887 | 0.20% |
| PUR ENERGY PVT LTD | 1,650 | 0.11% | 620 | 0.04% |
| Others Including EV | 9,891 | 0.65% | 10,887 | 0.74% |
| Total | 15,25,862 | 100% | 14,65,039 | 100% |
Source: FADA Research
Disclaimer:
- The above numbers do not have figures from TS.
- Vehicle Retail Data has been collated as on 04.02.25 in collaboration with Ministry of Road Transport & Highways, Government of India and has been gathered from 1,375 out of 1,436 RTOs.
- Others include OEMs accounting less than 0.1% Market Share.
| Three-Wheeler OEM | JAN’25 | Market Share (%) JAN’25 | JAN’24 | Market Share (%) JAN’24 |
| BAJAJ AUTO LTD | 39,488 | 36.89% | 37,148 | 37.09% |
| PIAGGIO VEHICLES PVT LTD | 7,904 | 7.38% | 8,271 | 8.26% |
| MAHINDRA & MAHINDRA LIMITED | 6,931 | 6.48% | 5,316 | 5.31% |
| MAHINDRA LAST MILE MOBILITY LTD | 6,895 | 6.44% | 4,814 | 4.81% |
| MAHINDRA & MAHINDRA LIMITED | 36 | 0.03% | 502 | 0.50% |
| YC ELECTRIC VEHICLE | 3,882 | 3.63% | 3,375 | 3.37% |
| ATUL AUTO LTD | 2,748 | 2.57% | 2,078 | 2.07% |
| TVS MOTOR COMPANY LTD | 2,703 | 2.53% | 1,840 | 1.84% |
| SAERA ELECTRIC AUTO PVT LTD | 2,270 | 2.12% | 2,361 | 2.36% |
| DILLI ELECTRIC AUTO PVT LTD | 1,924 | 1.80% | 2,007 | 2.00% |
| UNIQUE INTERNATIONAL | 1,108 | 1.04% | 1,114 | 1.11% |
| SAHNIANAND E VEHICLES PVT LTD | 1,092 | 1.02% | 713 | 0.71% |
| Others including EV | 36,983 | 34.55% | 35,937 | 35.88% |
| Total | 1,07,033 | 100% | 1,00,160 | 100% |
Source: FADA Research
Disclaimer:
- The above numbers do not have figures from TS.
- Vehicle Retail Data has been collated as on 04.02.25 in collaboration with Ministry of Road Transport & Highways, Government of India and has been gathered from 1,375 out of 1,436 RTOs.
- Others include OEMs accounting less than 1% Market Share.
| Commercial Vehicle OEM | JAN’25 | Market Share (%) JAN’25 | JAN’24 | Market Share (%) JAN’24 |
| TATA MOTORS LTD | 31,393 | 31.57% | 31,816 | 34.63% |
| MAHINDRA & MAHINDRA LIMITED | 27,523 | 27.68% | 23,675 | 25.77% |
| ASHOK LEYLAND LTD | 15,748 | 15.84% | 14,764 | 16.07% |
| VE COMMERCIAL VEHICLES LTD | 7,274 | 7.32% | 6,021 | 6.55% |
| MARUTI SUZUKI INDIA LTD | 5,224 | 5.25% | 4,227 | 4.60% |
| DAIMLER INDIA COMMERCIAL VEHICLES PVT. LTD | 2,151 | 2.16% | 2,169 | 2.36% |
| FORCE MOTORS LIMITED | 1,621 | 1.63% | 1,278 | 1.39% |
| SML ISUZU LTD | 690 | 0.69% | 677 | 0.74% |
| Others | 7,801 | 7.85% | 7,250 | 7.89% |
| Total | 99,425 | 100.00% | 91,877 | 100.00% |
Source: FADA Research
Disclaimer:
- The above numbers do not have figures from TS.
- Vehicle Retail Data has been collated as on 04.02.25 in collaboration with Ministry of Road Transport & Highways, Government of India and has been gathered from 1,375 out of 1,436 RTOs.
| PV OEM | JAN’25 | Market Share (%) JAN’25 | JAN’24 | Market Share (%) JAN’24 |
| MARUTI SUZUKI INDIA LTD | 2,11,074 | 45.30% | 1,75,489 | 43.51% |
| HYUNDAI MOTOR INDIA LTD | 59,858 | 12.85% | 52,906 | 13.12% |
| TATA MOTORS LTD | 53,884 | 11.57% | 54,104 | 13.42% |
| MAHINDRA & MAHINDRA LIMITED | 51,914 | 11.14% | 43,147 | 10.70% |
| TOYOTA KIRLOSKAR MOTOR PVT LTD | 28,907 | 6.20% | 21,439 | 5.32% |
| KIA INDIA PRIVATE LIMITED | 22,169 | 4.76% | 19,543 | 4.85% |
| SKODA AUTO VOLKSWAGEN GROUP | 9,140 | 1.96% | 9,091 | 2.25% |
| SKODA AUTO VOLKSWAGEN INDIA PVT LTD | 9,090 | 1.95% | 9,016 | 2.24% |
| VOLKSWAGEN AG/INDIA PVT. LTD. | – | 0.00% | – | 0.00% |
| AUDI AG | 41 | 0.01% | 73 | 0.02% |
| SKODA AUTO INDIA/AS PVT LTD | 9 | 0.00% | 2 | 0.00% |
| HONDA CARS INDIA LTD | 7,687 | 1.65% | 9,389 | 2.33% |
| MG MOTOR INDIA PVT LTD | 6,363 | 1.37% | 4,540 | 1.13% |
| RENAULT INDIA PVT LTD | 3,924 | 0.84% | 3,877 | 0.96% |
| NISSAN MOTOR INDIA PVT LTD | 2,532 | 0.54% | 2,829 | 0.70% |
| MERCEDES -BENZ GROUP | 1,779 | 0.38% | 1,474 | 0.37% |
| MERCEDES-BENZ INDIA PVT LTD | 1,616 | 0.35% | 1,336 | 0.33% |
| MERCEDES -BENZ AG | 132 | 0.03% | 130 | 0.03% |
| DAIMLER AG | 31 | 0.01% | 8 | 0.00% |
| BMW INDIA PVT LTD | 1,709 | 0.37% | 1,421 | 0.35% |
| FORCE MOTORS LIMITED | 843 | 0.18% | 727 | 0.18% |
| PCA AUTOMOBILES INDIA PVT LTD | 703 | 0.15% | 765 | 0.19% |
| JAGUAR LAND ROVER INDIA LIMITED | 468 | 0.10% | 311 | 0.08% |
| FCA INDIA AUTOMOBILES PRIVATE LIMITED | 419 | 0.09% | 497 | 0.12% |
| BYD INDIA PRIVATE LIMITED | 313 | 0.07% | 162 | 0.04% |
| VOLVO AUTO INDIA PVT LTD | 146 | 0.03% | 243 | 0.06% |
| Others | 2,088 | 0.45% | 1,346 | 0.33% |
| Total | 4,65,920 | 100% | 4,03,300 | 100% |
Source: FADA Research
Disclaimer:
- The above numbers do not have figures from TS.
- Vehicle Retail Data has been collated as on 04.02.25 in collaboration with Ministry of Road Transport & Highways, Government of India and has been gathered from 1,375 out of 1,436 RTOs.
| Tractor OEM | JAN’25 | Market Share (%) JAN’25 | JAN’24 | Market Share (%) JAN’24 |
| MAHINDRA & MAHINDRA LIMITED (TRACTOR) | 22,072 | 23.64% | 20,492 | 23.09% |
| MAHINDRA & MAHINDRA LIMITED (SWARAJ DIVISION) | 17,332 | 18.56% | 16,466 | 18.56% |
| INTERNATIONAL TRACTORS LIMITED | 12,285 | 13.16% | 11,519 | 12.98% |
| TAFE LIMITED | 10,834 | 11.60% | 11,007 | 12.40% |
| ESCORTS KUBOTA LIMITED (AGRI MACHINERY GROUP) | 9,123 | 9.77% | 8,188 | 9.23% |
| JOHN DEERE INDIA PVT LTD (TRACTOR DEVISION) | 6,641 | 7.11% | 5,731 | 6.46% |
| EICHER TRACTORS | 5,960 | 6.38% | 6,230 | 7.02% |
| CNH INDUSTRIAL (INDIA) PVT LTD | 4,011 | 4.30% | 3,509 | 3.95% |
| KUBOTA AGRICULTURAL MACHINERY INDIA PVT.LTD. | 1,631 | 1.75% | 1,738 | 1.96% |
| Others | 3,492 | 3.74% | 3,861 | 4.35% |
| Total | 93,381 | 100% | 88,741 | 100% |
Source: FADA Research
Disclaimer:
- The above numbers do not have figures from TS.
- Vehicle Retail Data has been collated as on 04.02.25 in collaboration with Ministry of Road Transport & Highways, Government of India and has been gathered from 1,375 out of 1,436 RTOs.


