
September 2024 Auto Retail Performance Shows Mixed Signals: FADA Reports Decline in Sales, High Inventory Levels Amid Festive Season
New Delhi: The Federation of Automobile Dealers Associations (FADA) has released its September 2024 vehicle retail data, painting a complex picture for the automobile industry. Despite the festive atmosphere of Ganesh Chaturthi and Onam, overall sales experienced a sharp decline of 9.26% year-on-year (YoY), highlighting subdued market sentiment and inventory challenges faced by dealers across segments.
H1 FY25 Auto Retail Snapshot: A Mixed Growth Story
In the first half of FY25, the automobile retail sector recorded a 6.55% YoY growth. Notably, the two-wheeler (2W), three-wheeler (3W), and passenger vehicle (PV) segments showed positive growth at 9.08%, 7.58%, and 1.07%, respectively. However, commercial vehicles (CV) and tractors (Trac) lagged, reporting declines of 0.65% and 8.82% YoY, respectively.
September 2024: A Closer Look
The latest report reveals an across-the-board decline, driven by weakened consumer sentiment, poor weather conditions, and seasonal factors. Here’s a breakdown by segment:
- Two-Wheelers (2W): Sales dropped by 8.51% YoY, largely attributed to low customer inquiries, heavy rainfall, and the Shraddh period, which typically curtails consumer spending.
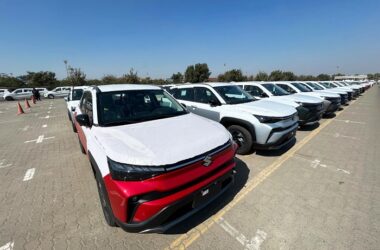
- Passenger Vehicles (PV): A significant 18.81% YoY decline reflects caution among consumers and dealers facing inventory challenges.
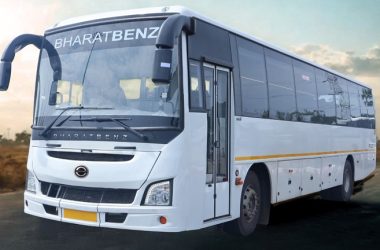
- Commercial Vehicles (CV): Despite a slight 1.46% month-on-month (MoM) improvement, CV sales fell 10.45% YoY, indicating sluggish government spending and a lack of momentum in infrastructure projects.
- Three-Wheelers (3W) and Tractors (Trac): These categories bucked the trend with modest growth of 0.66% and 14.69% YoY, respectively, benefiting from a rise in demand for e-rickshaws and positive customer engagement.
Monsoon Impact: A Double-Edged Sword
The 2024 southwest monsoon recorded an 8% surplus, the highest in four years. While the increased rainfall boosted agricultural productivity, it also hampered vehicle retail performance. Heavy rains disrupted dealership operations and deterred customer footfalls, affecting overall sales, particularly in rural markets.
Rising Inventory Levels: A Growing Concern for PV Dealers
The report highlights a critical issue facing the PV segment: inventory levels have soared to 80-85 days, equating to 7.9 lakh vehicles worth approximately ₹79,000 crore. Dealers are under mounting pressure as aggressive dispatches from OEMs have led to an inventory build-up. This has sparked calls from FADA for stricter guidelines on channel funding policies from the Reserve Bank of India (RBI) to protect dealers from financial strain.
Outlook for the Festive Season: Hopeful but Uncertain
With the upcoming festive season—marked by Navratri and Diwali—falling in the same month, the automobile industry is hopeful for a recovery. The favorable monsoon and improved agricultural yields are expected to drive rural demand, particularly in the 2W, PV, and Trac segments.
However, the high inventory levels in the PV segment pose a significant risk. If sales in October do not meet expectations, dealers may face further financial challenges, possibly requiring aggressive discounts and offers, which could squeeze profit margins.
FADA’s Perspective: Cautious Optimism Amid High Stakes
FADA President, Mr. C S Vigneshwar, commented on the situation: “Despite the favorable monsoon boosting rural sentiment, the market response during Ganesh Chaturthi and Onam has been lackluster. Dealers are now betting heavily on the festive season to clear inventories and stabilize cash flow. This is a critical period, and strategic promotions will be essential to leverage the anticipated surge in demand.”
Key Survey Findings: Mixed Sentiment Among Dealers
FADA’s online survey of its members revealed the following:
- Liquidity Conditions: 49.11% of respondents described liquidity as neutral, while 28.83% reported poor conditions, and 22.06% rated it positively.
- Market Sentiment: 44.13% of dealers expressed a neutral outlook, 30.60% felt optimistic, and 25.27% perceived the market sentiment as negative.
- Expectations for October 2024: A majority (66.55%) are optimistic, predicting growth, while 22.06% expect flat sales, and 11.39% foresee a decline.
The automotive industry faces a pivotal moment in October, with the festive season serving as a critical opportunity for recovery. Dealers and OEMs must navigate the high stakes with targeted promotions and inventory management strategies to capitalize on potential demand. While optimism prevails, the high inventory levels and dependency on October’s performance necessitate a cautious approach. A successful festive season is crucial to stabilize the market and set the stage for a positive second half of FY25.
All India Vehicle Retail Data for H1 FY’25
| CATEGORY | H1 FY’25 | H1 FY’24 | Growth % |
| 2W | 85,66,531 | 78,53,618 | 9.08% |
| 3W | 5,95,256 | 5,53,302 | 7.58% |
| CV | 4,77,381 | 4,80,488 | -0.65% |
| PV | 18,70,991 | 18,51,249 | 1.07% |
| TRAC | 4,05,804 | 4,45,077 | -8.82% |
| Total | 1,19,15,963 | 1,11,83,734 | 6.55% |
Source: FADA Research
All India Vehicle Retail Data for September’24
| CATEGORY | SEP’24 | AUG’24 | SEP’23 | MoM % | YoY % |
| 2W | 12,04,259 | 13,38,237 | 13,16,300 | -10.01% | -8.51% |
| 3W | 1,06,524 | 1,05,478 | 1,05,827 | 0.99% | 0.66% |
| E-RICKSHAW(P) | 44,043 | 44,346 | 46,712 | -0.68% | -5.71% |
| E-RICKSHAW WITH CART (G) | 4,569 | 4,392 | 3,038 | 4.03% | 50.39% |
| THREE-WHEELER (GOODS) | 9,108 | 8,646 | 9,591 | 5.34% | -5.04% |
| THREE-WHEELER (PASSENGER) | 48,714 | 48,005 | 46,404 | 1.48% | 4.98% |
| THREE-WHEELER (PERSONAL) | 90 | 89 | 82 | 1.12% | 9.76% |
| PV | 2,75,681 | 3,09,053 | 3,39,543 | -10.80% | -18.81% |
| TRAC | 62,542 | 65,478 | 54,529 | -4.48% | 14.69% |
| CV | 74,324 | 73,253 | 82,993 | 1.46% | -10.45% |
| LCV | 41,715 | 42,496 | 47,334 | -1.84% | -11.87% |
| MCV | 6,090 | 6,137 | 5,855 | -0.77% | 4.01% |
| HCV | 22,941 | 21,221 | 25,984 | 8.11% | -11.71% |
| Others | 3,578 | 3,399 | 3,820 | 5.27% | -6.34% |
| Total | 17,23,330 | 18,91,499 | 18,99,192 | -8.89% | -9.26% |
Source: FADA Research
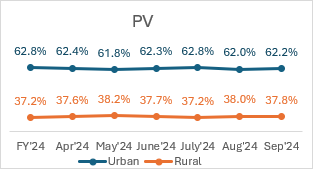
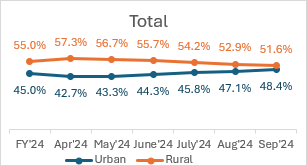
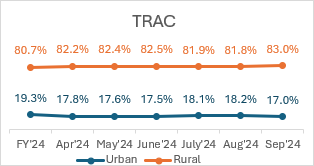
All India Vehicle Retail Strength Index for Sep’24 on basis of Urban & Rural RTOs.
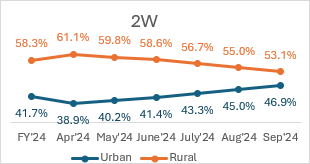
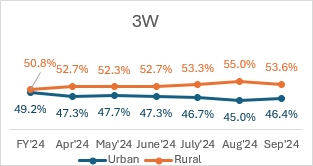
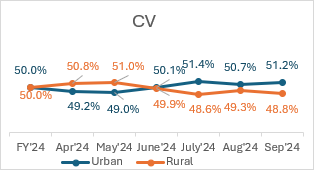
All India Vehicle Retail Strength YoY and MOM comparison for Sep’24.
| Urban | Rural | |||
| CATEGORY | MoM% | YOY% | MoM% | YOY% |
| 2W | 4.34% | 3.43% | -3.55% | -2.85% |
| 3W | 3.28% | -4.11% | -2.68% | 3.86% |
| CV | 1.00% | 1.75% | -1.03% | -1.78% |
| PV | 0.30% | -3.13% | -0.49% | 5.62% |
| TRAC | -6.88% | -11.29% | 1.54% | 2.67% |
| Total | 2.94% | 0.14% | -2.62% | -0.13% |
Source: FADA Research
All India Vehicle Retail Strength YoY comparison for H1 FY’24.
| Category | Urban | Rural |
| 2W | -1.19% | 0.90% |
| 3W | -7.27% | 7.38% |
| CV | -1.20% | 1.24% |
| PV | -2.73% | 4.86% |
| TRAC | -11.67% | 2.92% |
| Total | -2.25% | 1.93% |
Source: FADA Research
Motor Vehicle Road Tax Collection (in Rs Crore)
| Sep’24 | Aug’24 | Sep’23 | MoM% | YoY% | |
| Motor Vehicle Road Tax Collection | 5,947 | 6,725 | 6,242 | -11.6% | -4.7% |
Source: FADA Research
OEM wise Market Share Data for the Month of Sep’24 with YoY comparison
| Two-Wheeler OEM | SEP’24 | Market Share (%) SEP’24 | SEP’23 | Market Share (%) SEP’23 |
| HONDA MOTORCYCLE AND SCOOTER INDIA (P) LTD | 3,33,927 | 27.73% | 3,49,784 | 26.57% |
| HERO MOTOCORP LTD | 2,71,390 | 22.54% | 3,52,254 | 26.76% |
| TVS MOTOR COMPANY LTD | 2,21,257 | 18.37% | 2,29,381 | 17.43% |
| BAJAJ AUTO GROUP | 1,41,668 | 11.76% | 1,49,633 | 11.37% |
| BAJAJ AUTO LTD | 1,41,668 | 11.76% | 1,49,633 | 11.37% |
| CHETAK TECHNOLOGY LIMITED | – | 0.00% | – | 0.00% |
| SUZUKI MOTORCYCLE INDIA PVT LTD | 74,287 | 6.17% | 73,837 | 5.61% |
| ROYAL-ENFIELD (UNIT OF EICHER LTD) | 57,504 | 4.78% | 64,159 | 4.87% |
| INDIA YAMAHA MOTOR PVT LTD | 50,065 | 4.16% | 49,639 | 3.77% |
| OLA ELECTRIC TECHNOLOGIES PVT LTD | 24,679 | 2.05% | 18,711 | 1.42% |
| ATHER ENERGY PVT LTD | 12,718 | 1.06% | 7,195 | 0.55% |
| GREAVES ELECTRIC MOBILITY PVT LTD | 2,777 | 0.23% | 3,613 | 0.27% |
| PIAGGIO VEHICLES PVT LTD | 2,562 | 0.21% | 2,954 | 0.22% |
| CLASSIC LEGENDS PVT LTD | 2,125 | 0.18% | 2,483 | 0.19% |
| BGAUSS AUTO PRIVATE LIMITED | 1,237 | 0.10% | 935 | 0.07% |
| Others Including EV | 8,063 | 0.67% | 11,722 | 0.89% |
| Total | 12,04,259 | 100% | 13,16,300 | 100% |
Source: FADA Research
Disclaimer:
- The above numbers do not have figures from TS.
- Vehicle Retail Data has been collated as on 05.10.24 in collaboration with Ministry of Road Transport & Highways, Government of India and has been gathered from 1,365 out of 1,429 RTOs.
- Others include OEMs accounting less than 0.1% Market Share.
| Three-Wheeler OEM | SEP’24 | Market Share (%) SEP’24 | SEP’23 | Market Share (%) SEP’23 |
| BAJAJ AUTO LTD | 37,425 | 35.13% | 38,025 | 35.93% |
| PIAGGIO VEHICLES PVT LTD | 7,778 | 7.30% | 8,280 | 7.82% |
| MAHINDRA & MAHINDRA LIMITED | 6,716 | 6.30% | 5,860 | 5.54% |
| MAHINDRA LAST MILE MOBILITY LTD | 6,634 | 6.23% | 89 | 0.08% |
| MAHINDRA & MAHINDRA LIMITED | 82 | 0.08% | 5,771 | 5.45% |
| MAHINDRA REVA ELECTRIC VEHICLES PVT LTD | – | 0.00% | – | 0.00% |
| YC ELECTRIC VEHICLE | 3,826 | 3.59% | 3,992 | 3.77% |
| SAERA ELECTRIC AUTO PVT LTD | 2,514 | 2.36% | 3,140 | 2.97% |
| ATUL AUTO LTD | 2,182 | 2.05% | 2,162 | 2.04% |
| DILLI ELECTRIC AUTO PVT LTD | 2,097 | 1.97% | 2,338 | 2.21% |
| TVS MOTOR COMPANY LTD | 2,009 | 1.89% | 1,422 | 1.34% |
| ENERGY ELECTRIC VEHICLES | 1,203 | 1.13% | 1,155 | 1.09% |
| UNIQUE INTERNATIONAL | 1,198 | 1.12% | 1,324 | 1.25% |
| MINI METRO EV L.L.P | 1,175 | 1.10% | 1,395 | 1.32% |
| HOTAGE INDIA | 1,115 | 1.05% | 1,262 | 1.19% |
| Others including EV | 37,286 | 35.00% | 35,472 | 33.52% |
| Total | 1,06,524 | 100% | 1,05,827 | 100% |
Source: FADA Research
Disclaimer:
- The above numbers do not have figures from TS.
- Vehicle Retail Data has been collated as on 05.10.24 in collaboration with Ministry of Road Transport & Highways, Government of India and has been gathered from 1,365 out of 1,429 RTOs.
- Others include OEMs accounting less than 1% Market Share.
| Commercial Vehicle OEM | SEP’24 | Market Share (%) SEP’24 | SEP’23 | Market Share (%) SEP’23 |
| TATA MOTORS LTD | 24,872 | 33.46% | 29,798 | 35.90% |
| MAHINDRA & MAHINDRA LIMITED | 18,666 | 25.11% | 20,747 | 25.00% |
| ASHOK LEYLAND LTD | 12,519 | 16.84% | 13,351 | 16.09% |
| VE COMMERCIAL VEHICLES LTD | 6,011 | 8.09% | 5,890 | 7.10% |
| MARUTI SUZUKI INDIA LTD | 3,453 | 4.65% | 3,513 | 4.23% |
| DAIMLER INDIA COMMERCIAL VEHICLES PVT. LTD | 1,518 | 2.04% | 1,682 | 2.03% |
| FORCE MOTORS LIMITED | 1,322 | 1.78% | 1,269 | 1.53% |
| SML ISUZU LTD | 913 | 1.23% | 761 | 0.92% |
| Others | 5,050 | 6.79% | 5,982 | 7.21% |
| Total | 74,324 | 100.00% | 82,993 | 100.00% |
Source: FADA Research
Disclaimer:
- The above numbers do not have figures from TS.
- Vehicle Retail Data has been collated as on 05.10.24 in collaboration with Ministry of Road Transport & Highways, Government of India and has been gathered from 1,365 out of 1,429 RTOs.
| PV OEM | SEP’24 | Market Share (%) SEP’24 | SEP’23 | Market Share (%)SEP’23 |
| MARUTI SUZUKI INDIA LTD | 1,13,560 | 41.19% | 1,41,318 | 41.62% |
| HYUNDAI MOTOR INDIA LTD | 37,973 | 13.77% | 50,633 | 14.91% |
| MAHINDRA & MAHINDRA LIMITED | 34,607 | 12.55% | 34,471 | 10.15% |
| TATA MOTORS LTD | 31,947 | 11.59% | 39,514 | 11.64% |
| TOYOTA KIRLOSKAR MOTOR PVT LTD | 19,660 | 7.13% | 18,845 | 5.55% |
| KIA INDIA PRIVATE LIMITED | 15,521 | 5.63% | 21,645 | 6.37% |
| SKODA AUTO VOLKSWAGEN GROUP | 5,192 | 1.88% | 8,249 | 2.43% |
| SKODA AUTO VOLKSWAGEN INDIA PVT LTD | 5,147 | 1.87% | 8,167 | 2.41% |
| VOLKSWAGEN AG/INDIA PVT. LTD. | 1 | 0.00% | 3 | 0.00% |
| AUDI AG | 37 | 0.01% | 77 | 0.02% |
| SKODA AUTO INDIA/AS PVT LTD | 7 | 0.00% | 2 | 0.00% |
| HONDA CARS INDIA LTD | 3,893 | 1.41% | 7,045 | 2.07% |
| MG MOTOR INDIA PVT LTD | 2,966 | 1.08% | 4,027 | 1.19% |
| RENAULT INDIA PVT LTD | 2,706 | 0.98% | 3,595 | 1.06% |
| NISSAN MOTOR INDIA PVT LTD | 2,109 | 0.77% | 2,176 | 0.64% |
| MERCEDES -BENZ GROUP | 1,308 | 0.47% | 1,451 | 0.43% |
| MERCEDES-BENZ INDIA PVT LTD | 1,170 | 0.42% | 1,335 | 0.39% |
| MERCEDES -BENZ AG | 129 | 0.05% | 107 | 0.03% |
| DAIMLER AG | 9 | 0.00% | 9 | 0.00% |
| BMW INDIA PVT LTD | 1,011 | 0.37% | 1,175 | 0.35% |
| PCA AUTOMOBILES INDIA PVT LTD | 656 | 0.24% | 475 | 0.14% |
| FORCE MOTORS LIMITED | 543 | 0.20% | 603 | 0.18% |
| JAGUAR LAND ROVER INDIA LIMITED | 447 | 0.16% | 448 | 0.13% |
| FCA INDIA AUTOMOBILES PRIVATE LIMITED | 349 | 0.13% | 427 | 0.13% |
| BYD INDIA PRIVATE LIMITED | 163 | 0.06% | 151 | 0.04% |
| VOLVO AUTO INDIA PVT LTD | 112 | 0.04% | 186 | 0.05% |
| Others | 958 | 0.35% | 3,109 | 0.92% |
| Total | 2,75,681 | 100% | 3,39,543 | 100% |
Source: FADA Research
Disclaimer:
- The above numbers do not have figures from TS.
- Vehicle Retail Data has been collated as on 05.10.24 in collaboration with Ministry of Road Transport & Highways, Government of India and has been gathered from 1,365 out of 1,429 RTOs.
| Tractor OEM | SEP’24 | Market Share (%) SEP’24 | SEP’23 | Market Share (%) SEP’23 |
| MAHINDRA & MAHINDRA LIMITED (TRACTOR) | 14,762 | 23.60% | 12,604 | 23.11% |
| MAHINDRA & MAHINDRA LIMITED (SWARAJ DIVISION) | 11,011 | 17.61% | 9,860 | 18.08% |
| INTERNATIONAL TRACTORS LIMITED | 8,116 | 12.98% | 7,061 | 12.95% |
| TAFE LIMITED | 7,285 | 11.65% | 6,869 | 12.60% |
| ESCORTS KUBOTA LIMITED (AGRI MACHINERY GROUP) | 6,313 | 10.09% | 5,832 | 10.70% |
| JOHN DEERE INDIA PVT LTD (TRACTOR DEVISION) | 4,843 | 7.74% | 3,775 | 6.92% |
| EICHER TRACTORS | 3,804 | 6.08% | 3,745 | 6.87% |
| CNH INDUSTRIAL (INDIA) PVT LTD | 2,525 | 4.04% | 1,901 | 3.49% |
| KUBOTA AGRICULTURAL MACHINERY INDIA PVT.LTD. | 1,201 | 1.92% | 919 | 1.69% |
| Others | 2,682 | 4.29% | 1,963 | 3.60% |
| Total | 62,542 | 100% | 54,529 | 100% |
Source: FADA Research
Disclaimer:
- The above numbers do not have figures from TS.
- Vehicle Retail Data has been collated as on 05.10.24 in collaboration with Ministry of Road Transport & Highways, Government of India and has been gathered from 1,365 out of 1,429 RTOs.