


7th March’24, New Delhi, BHARAT – In an exhilarating sprint through the month of February 2024, India’s automobile retail sector left skid marks of growth across all categories, surging ahead by a notable 13% year-over-year (YoY). The Federation of Automobile Dealers Associations (FADA) was all revved up as they announced these figures, indicating a gear shift in the Indian auto market’s trajectory towards higher volumes and electric dreams.
President of FADA, Manish Raj Singhania, was like a proud pit crew chief as he detailed the performance stats: Two-wheelers (2W) darted ahead with a 13% growth, propelled by the rural thrust and a hunger for premium rides; three-wheelers (3W) zoomed with a 24% increase, electrically charged with over half of this growth electrified; passenger vehicles (PV) cruised to a record-breaking 12% YoY growth, marking the highest February sales in history; tractors plowed through with an 11% growth, and commercial vehicles (CV) trucked a resilient 5% improvement despite economic speed bumps.
The 2W segment’s race was fuelled by broader product availability and tempting deals, with factors like favorable marriage dates turbocharging sales. Meanwhile, the 3W sector’s electric surge signals a shift towards cleaner, plug-in power, driven by first-time users and a move to electric E-Rickshaws.
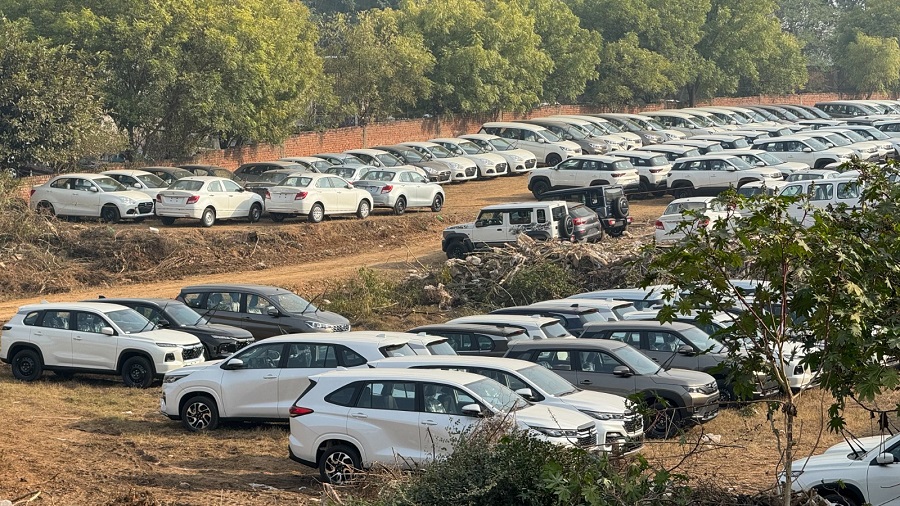
PVs, enjoying the spotlight with historic sales figures, face the challenge of parking too much inventory, hovering at a 50-55 day supply. Dealers are flashing warning lights at Original Equipment Manufacturers (OEMs) to dial down production and help ease the financial weight of unsold stock.
The CV sector showed its metal by overcoming obstacles like cash flow potholes and election-related purchase pauses, proving its enduring strength and essential role in India’s economic engine.
As we shift gears towards March 2024, the auto sector approaches a crossroad of optimism and caution. The rural market sends promising signals, and the financial year-end is expected to rev up buying activities. However, looming elections might pump the brakes on purchases, with supply chain snarls and unpredictable factors like crop failures possibly deflating market enthusiasm.
Despite these mixed signals, dealers are tuning up for a potentially prosperous period, balancing the accelerator of aggressive sales targets with the brakes of inventory management and evolving consumer tastes.
A pit stop check of inventory levels showed passenger vehicles in a bit of a pile-up, with 50-55 days of stock, while two-wheelers kept lean with 10-15 days. The financial fuel gauge reads a mix of sentiments, with nearly half of the dealers feeling neutral about liquidity, a third in good spirits, and a cautious few running low.
As for what’s ahead, dealers are hopeful, with over half expecting growth in March, a solid third forecasting a flat landscape, and only a small fraction bracing for a downhill shift.
With engines warmed and headlights bright, the Indian auto retail sector is racing into a future charged with electric potential, financial year-end boosts, and the ever-present thrill of navigating the unpredictable bends of market demands and economic conditions.
All India Vehicle Retail Data for Feb’24
| CATEGORY | FEB’24 | FEB’23 | YoY % | JAN’24 | MoM% |
| 2W | 14,39,523 | 12,71,073 | 13.25% | 14,58,849 | -1.32% |
| 3W | 94,918 | 76,619 | 23.88% | 97,675 | -2.82% |
| E-RICKSHAW(P) | 36,579 | 30,736 | 19.01% | 40,526 | -9.74% |
| E-RICKSHAW WITH CART (G) | 4,435 | 2,446 | 81.32% | 3,739 | 18.61% |
| THREE-WHEELER (GOODS) | 10,768 | 8,305 | 29.66% | 10,163 | 5.95% |
| THREE-WHEELER (PASSENGER) | 43,065 | 35,076 | 22.78% | 43,188 | -0.28% |
| THREE-WHEELER (PERSONAL) | 71 | 56 | 26.79% | 59 | 20.34% |
| PV | 3,30,107 | 2,93,803 | 12.36% | 3,93,250 | -16.06% |
| TRAC | 76,626 | 69,034 | 11.00% | 88,671 | -13.58% |
| CV | 88,367 | 84,337 | 4.78% | 89,208 | -0.94% |
| LCV | 48,594 | 47,551 | 2.19% | 49,835 | -2.49% |
| MCV | 6,454 | 5,001 | 29.05% | 5,454 | 18.34% |
| HCV | 28,271 | 28,359 | -0.31% | 29,179 | -3.11% |
| Others | 5,048 | 3,426 | 47.34% | 4,740 | 6.50% |
| Total | 20,29,541 | 17,94,866 | 13.07% | 21,27,653 | -4.61% |
Source: FADA Research
- The above numbers do not have figures from TS & LD.
- Vehicle Retail Data has been collated as on 06.03.24 in collaboration with Ministry of Road Transport & Highways, Government of India and has been gathered from 1,358 out of 1,445 RTOs.
- Commercial Vehicle is subdivided in the following manner
- LCV – Light Commercial Vehicle (incl. Passenger & Goods Vehicle)
- MCV – Medium Commercial Vehicle (incl. Passenger & Goods Vehicle)
- HCV – Heavy Commercial Vehicle (incl. Passenger & Goods Vehicle)
- Others – Construction Equipment Vehicles and others
- 3-Wheeler is sub-divided in the following manner
- E-Rickshaw – Passenger
- E-Rickshaw – Goods
- 3-Wheeler – Goods
- 3-Wheeler – Passenger
- 3-Wheeler – Personal
OEM wise Market Share Data for the Month of Feb’24 with YoY comparison
| Two-Wheeler OEM | FEB’24 | Market Share (%) FEB’24 | FEB’23 | Market Share (%) FEB’23 |
| HERO MOTOCORP LTD | 4,13,470 | 28.72% | 3,91,044 | 30.76% |
| HONDA MOTORCYCLE AND SCOOTER INDIA (P) LTD | 3,55,223 | 24.68% | 3,02,833 | 23.82% |
| TVS MOTOR COMPANY LTD | 2,47,880 | 17.22% | 2,11,988 | 16.68% |
| BAJAJ AUTO GROUP | 1,71,155 | 11.89% | 1,40,053 | 11.02% |
| BAJAJ AUTO LTD | 1,71,154 | 11.89% | 1,38,734 | 10.91% |
| CHETAK TECHNOLOGY LIMITED | 1 | 0.00% | 1,319 | 0.10% |
| SUZUKI MOTORCYCLE INDIA PVT LTD | 73,167 | 5.08% | 59,220 | 4.66% |
| ROYAL-ENFIELD (UNIT OF EICHER LTD) | 64,708 | 4.50% | 65,128 | 5.12% |
| INDIA YAMAHA MOTOR PVT LTD | 53,114 | 3.69% | 42,821 | 3.37% |
| OLA ELECTRIC TECHNOLOGIES PVT LTD | 33,846 | 2.35% | 17,773 | 1.40% |
| ATHER ENERGY PVT LTD | 9,004 | 0.63% | 10,071 | 0.79% |
| PIAGGIO VEHICLES PVT LTD | 2,886 | 0.20% | 2,798 | 0.22% |
| CLASSIC LEGENDS PVT LTD | 2,556 | 0.18% | 3,214 | 0.25% |
| GREAVES ELECTRIC MOBILITY PVT LTD | 2,484 | 0.17% | 153 | 0.01% |
| Others Including EV | 10,030 | 0.70% | 23,977 | 1.89% |
| Total | 14,39,523 | 100% | 12,71,073 | 100% |
Source: FADA Research
Disclaimer:
- The above numbers do not have figures from TS & LD.
- Vehicle Retail Data has been collated as on 06.03.24 in collaboration with Ministry of Road Transport & Highways, Government of India and has been gathered from 1,358 out of 1,445 RTOs.
- Others include OEMs accounting less than 0.1% Market Share.
| Three-Wheeler OEM | FEB’24 | Market Share (%) FEB’24 | FEB’23 | Market Share (%) FEB’23 |
| BAJAJ AUTO LTD | 34,677 | 36.53% | 29,883 | 39.00% |
| PIAGGIO VEHICLES PVT LTD | 8,010 | 8.44% | 6,780 | 8.85% |
| MAHINDRA & MAHINDRA LIMITED | 5,853 | 6.17% | 4,686 | 6.12% |
| MAHINDRA LAST MILE MOBILITY LTD | 5,459 | 5.75% | – | 0.00% |
| MAHINDRA & MAHINDRA LIMITED | 382 | 0.40% | 3,014 | 3.93% |
| MAHINDRA REVA ELECTRIC VEHICLES PVT LTD | 12 | 0.01% | 1,672 | 2.18% |
| YC ELECTRIC VEHICLE | 3,356 | 3.54% | 2,620 | 3.42% |
| SAERA ELECTRIC AUTO PVT LTD | 2,090 | 2.20% | 1,856 | 2.42% |
| DILLI ELECTRIC AUTO PVT LTD | 1,990 | 2.10% | 1,564 | 2.04% |
| ATUL AUTO LTD | 1,961 | 2.07% | 1,975 | 2.58% |
| TVS MOTOR COMPANY LTD | 1,926 | 2.03% | 1,336 | 1.74% |
| MINI METRO EV L.L.P | 1,154 | 1.22% | 942 | 1.23% |
| UNIQUE INTERNATIONAL | 1,028 | 1.08% | 825 | 1.08% |
| HOTAGE CORPORATION INDIA | 996 | 1.05% | 634 | 0.83% |
| J. S. AUTO (P) LTD | 963 | 1.01% | 915 | 1.19% |
| Others including EV | 30,914 | 32.57% | 22,603 | 29.50% |
| Total | 94,918 | 100% | 76,619 | 100% |
Source: FADA Research
Disclaimer:
- The above numbers do not have figures from TS & LD.
- Vehicle Retail Data has been collated as on 06.03.24 in collaboration with Ministry of Road Transport & Highways, Government of India and has been gathered from 1,358 out of 1,445 RTOs.
- Others include OEMs accounting less than 1% Market Share.
| Commercial Vehicle OEM | FEB’24 | Market Share (%) FEB’24 | FEB’23 | Market Share (%) FEB’23 |
| TATA MOTORS LTD | 31,915 | 36.12% | 31,958 | 37.89% |
| MAHINDRA & MAHINDRA LIMITED | 21,206 | 24.00% | 19,354 | 22.95% |
| ASHOK LEYLAND LTD | 14,736 | 16.68% | 14,589 | 17.30% |
| VE COMMERCIAL VEHICLES LTD | 5,979 | 6.77% | 5,906 | 7.00% |
| MARUTI SUZUKI INDIA LTD | 3,323 | 3.76% | 3,318 | 3.93% |
| FORCE MOTORS LIMITED, A FIRODIA ENTERPRISE | 2,024 | 2.29% | 920 | 1.09% |
| DAIMLER INDIA COMMERCIAL VEHICLES PVT. LTD | 1,837 | 2.08% | 1,800 | 2.13% |
| SML ISUZU LTD | 771 | 0.87% | 550 | 0.65% |
| Others | 6,576 | 7.44% | 5,942 | 7.05% |
| Total | 88,367 | 100.00% | 84,337 | 100.00% |
Source: FADA Research
Disclaimer:
- The above numbers do not have figures from TS & LD.
- Vehicle Retail Data has been collated as on 06.03.24 in collaboration with Ministry of Road Transport & Highways, Government of India and has been gathered from 1,358 out of 1,445 RTOs.
| PV OEM | FEB’24 | Market Share (%) FEB’24 | FEB’23 | Market Share (% )FEB’23 |
| MARUTI SUZUKI INDIA LTD | 1,31,191 | 39.74% | 1,20,381 | 40.97% |
| HYUNDAI MOTOR INDIA LTD | 46,464 | 14.08% | 39,870 | 13.57% |
| TATA MOTORS LTD | 44,784 | 13.57% | 39,561 | 13.47% |
| MAHINDRA & MAHINDRA LIMITED | 38,071 | 11.53% | 30,645 | 10.43% |
| KIA MOTORS INDIA PVT LTD | 20,357 | 6.17% | 20,141 | 6.86% |
| TOYOTA KIRLOSKAR MOTOR PVT LTD | 19,498 | 5.91% | 12,819 | 4.36% |
| HONDA CARS INDIA LTD | 6,597 | 2.00% | 5,886 | 2.00% |
| SKODA AUTO VOLKSWAGEN GROUP | 5,742 | 1.74% | 7,134 | 2.43% |
| SKODA AUTO VOLKSWAGEN INDIA PVT LTD | 5,690 | 1.72% | 6,971 | 2.37% |
| VOLKSWAGEN AG/INDIA PVT. LTD. | – | 0.00% | 5 | 0.00% |
| AUDI AG | 52 | 0.02% | 156 | 0.05% |
| SKODA AUTO INDIA/AS PVT LTD | – | 0.00% | 2 | 0.00% |
| MG MOTOR INDIA PVT LTD | 3,738 | 1.13% | 3,776 | 1.29% |
| RENAULT INDIA PVT LTD | 3,568 | 1.08% | 4,950 | 1.68% |
| NISSAN MOTOR INDIA PVT LTD | 2,398 | 0.73% | 2,275 | 0.77% |
| MERCEDES -BENZ GROUP | 1,252 | 0.38% | 1,162 | 0.40% |
| MERCEDES-BENZ INDIA PVT LTD | 1,162 | 0.35% | 1,070 | 0.36% |
| MERCEDES -BENZ AG | 89 | 0.03% | 90 | 0.03% |
| DAIMLER AG | 1 | 0.00% | 2 | 0.00% |
| BMW INDIA PVT LTD | 1,040 | 0.32% | 666 | 0.23% |
| FORCE MOTORS LIMITED, A FIRODIA ENTERPRISE | 805 | 0.24% | 704 | 0.24% |
| PCA AUTOMOBILES INDIA PVT LTD | 558 | 0.17% | 629 | 0.21% |
| FIAT INDIA AUTOMOBILES PVT LTD | 399 | 0.12% | 697 | 0.24% |
| JAGUAR LAND ROVER INDIA LIMITED | 257 | 0.08% | 168 | 0.06% |
| VOLVO AUTO INDIA PVT LTD | 165 | 0.05% | 153 | 0.05% |
| BYD INDIA PRIVATE LIMITED | 143 | 0.04% | 242 | 0.08% |
| Others | 3,080 | 0.93% | 1,944 | 0.66% |
| Total | 3,30,107 | 100% | 2,93,803 | 100% |
Source: FADA Research
Disclaimer:
- The above numbers do not have figures from TS & LD.
- Vehicle Retail Data has been collated as on 06.03.24 in collaboration with Ministry of Road Transport & Highways, Government of India and has been gathered from 1,358 out of 1,445 RTOs.
| Tractor OEM | FEB’24 | Market Share (%) FEB’24 | FEB’23 | Market Share (%) FEB’23 |
| MAHINDRA & MAHINDRA LIMITED (TRACTOR) | 17,490 | 22.83% | 15,889 | 23.02% |
| MAHINDRA & MAHINDRA LIMITED (SWARAJ DIVISION) | 14,100 | 18.40% | 12,478 | 18.08% |
| INTERNATIONAL TRACTORS LIMITED | 9,841 | 12.84% | 8,619 | 12.49% |
| TAFE LIMITED | 8,307 | 10.84% | 6,608 | 9.57% |
| ESCORTS LIMITED (AGRI MACHINERY GROUP) | 7,449 | 9.72% | 7,344 | 10.64% |
| JOHN DEERE INDIA PVT LTD(TRACTOR DEVISION) | 5,906 | 7.71% | 5,958 | 8.63% |
| EICHER TRACTORS | 5,366 | 7.00% | 3,932 | 5.70% |
| CNH INDUSTRIAL (INDIA) PVT LTD | 3,016 | 3.94% | 2,656 | 3.85% |
| KUBOTA AGRICULTURAL MACHINERY INDIA PVT.LTD. | 1,735 | 2.26% | 1,966 | 2.85% |
| CAPTAIN TRACTORS PVT. LTD. | 498 | 0.65% | 249 | 0.36% |
| V.S.T. TILLERS TRACTORS LIMITED | 341 | 0.45% | 462 | 0.67% |
| GROMAX AGRI EQUIPMENT LTD | 308 | 0.40% | 253 | 0.37% |
| Others | 2,269 | 2.96% | 2,620 | 3.80% |
| Total | 76,626 | 100% | 69,034 | 100% |
Source: FADA Research
Disclaimer:
- The above numbers do not have figures from TS & LD.
- Vehicle Retail Data has been collated as on 06.03.24 in collaboration with Ministry of Road Transport & Highways, Government of India and has been gathered from 1,358 out of 1,445 RTOs.