
New Delhi – India’s auto retail sector took a mild pit stop in July, with the Federation of Automobile Dealers Associations (FADA) reporting a 4.31% year-on-year slowdown. After three consecutive months of acceleration, the industry briefly tapped the brakes, citing everything from heavy rains to heavy hesitation in customer wallets.
Two-Wheelers:
Once the reigning champions of rural mobility, 2Ws skidded 6.48% YoY as farmers focused more on sowing seeds than signing sales receipts. Dealers, however, remain upbeat, expecting the festive season to turn rural mud into sales gold.
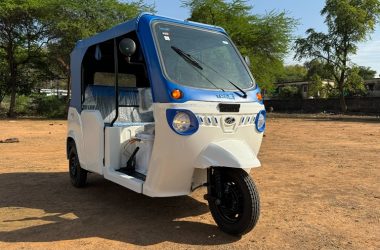
Passenger Vehicles:
PV sales slipped 0.81% YoY despite a robust 10.38% MoM jump, powered by rural customers who apparently found the Aashaada period quite auspicious for buying new wheels. Urban buyers, however, seemed to have adopted a “look but don’t book” policy. Inventory levels hover around a sturdy 55 days—perfect for the oncoming festive sprint.
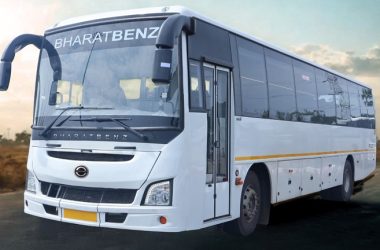
Commercial Vehicles:
CVs managed a hairline 0.23% YoY rise, fuelled by new model launches, institutional orders, and a sudden national enthusiasm for school buses. Rural CV demand, on the other hand, faced more potholes than an unmonitored highway.
Tractors:
The tractor segment was the surprise overachiever, revving up 10.96% YoY. Credit goes to generous agri-subsidies, farmer-friendly rainfall, and a liquidity boost that had rural India ploughing money into horsepower.
Construction Equipment:
CE took the hardest hit with a 33.28% YoY nosedive, proving that while you can build roads, you can’t always pave over market headwinds.
With four major festivals—Rakhi, Janmashtami, Independence Day, and Ganesh Chaturthi—lined up in August, dealers are polishing their stock and sharpening their sales pitches. The monsoon is expected to behave (mostly), but external factors like new U.S. export tariffs and rupee wobbles could throw in some surprise speed breakers.
In FADA President C.S. Vigneshwar’s words, the road ahead is one of “guarded optimism.” Translation: we’re ready for the green flag, but keeping one eye on the rearview mirror.
If August delivers as expected, the industry could go from rain-checked to record-breaking—proving once again that in India, nothing sells cars like a good festival, a bit of rural liquidity, and the irresistible scent of fresh monsoon mud.
Chart showing Vehicle Retail Data for July’25
All India Vehicle Retail Data for YTD FY’26 (Apr’25 to July’25)
| CATEGORY | YTD FY’26 | YTD FY’25 | Growth % |
| 2W | 61,62,619 | 60,20,223 | 2.37% |
| 3W | 4,16,275 | 3,83,238 | 8.62% |
| CV | 3,11,951 | 3,09,059 | 0.94% |
| CE | 24,568 | 24,240 | 1.35% |
| PV | 13,09,676 | 12,78,236 | 2.46% |
| TRAC | 2,98,978 | 2,77,691 | 7.67% |
| Total | 85,24,067 | 82,92,687 | 2.79% |
All India Vehicle Retail Data for July’25
| CATEGORY | July’25 | June’25 | July’24 | MoM% | YoY% |
| 2W | 13,55,504 | 14,46,387 | 14,49,487 | -6.28% | -6.48% |
| 3W | 1,11,426 | 1,00,625 | 1,10,511 | 10.73% | 0.83% |
| E-RICKSHAW(P) | 39,798 | 35,367 | 44,462 | 12.53% | -10.49% |
| E-RICKSHAW WITH CART (G) | 6,813 | 6,846 | 5,186 | -0.48% | 31.37% |
| THREE-WHEELER (GOODS) | 9,862 | 9,468 | 10,197 | 4.16% | -3.29% |
| THREE-WHEELER (PASSENGER) | 54,861 | 48,848 | 50,593 | 12.31% | 8.44% |
| THREE-WHEELER (PERSONAL) | 92 | 96 | 73 | -4.17% | 26.03% |
| PV | 3,28,613 | 2,97,722 | 3,31,280 | 10.38% | -0.81% |
| TRAC | 88,722 | 77,214 | 79,961 | 14.90% | 10.96% |
| CE | 3,509 | 8,558 | 5,259 | -59.00% | -33.28% |
| CV | 76,439 | 73,367 | 76,261 | 4.19% | 0.23% |
| LCV | 45,808 | 44,469 | 45,565 | 3.01% | 0.53% |
| MCV | 7,414 | 7,393 | 6,712 | 0.28% | 10.46% |
| HCV | 23,154 | 21,447 | 23,912 | 7.96% | -3.17% |
| Others | 63 | 58 | 72 | 8.62% | -12.50% |
| Total | 19,64,213 | 20,03,873 | 20,52,759 | -1.98% | -4.31% |
Source: FADA Research
Chart showing Fuel Wise Vehicle Retail Market Share for July’25
| Two-Wheeler | July’25 | June’25 | July’24 | Three-Wheeler | July’25 | June’25 | July’24 | |
| PETROL/ETHANOL | 92.12% | 92.50% | 92.55% | EV | 62.06% | 60.18% | 57.63% | |
| EV | 7.60% | 7.28% | 7.43% | CNG/LPG | 26.78% | 28.24% | 30.81% | |
| CNG/LPG | 0.28% | 0.22% | 0.02% | DIESEL | 10.78% | 11.16% | 10.76% | |
| Total | 100% | 100% | 100% | PETROL/ETHANOL | 0.38% | 0.42% | 0.80% | |
| Total | 100% | 100% | 100% |
| Commercial Vehicle | July’25 | June’25 | July’24 | Construction Equipment | July’25 | June’25 | July’24 | |
| Diesel | 81.46% | 82.21% | 82.73% | Diesel | 99% | 99.89% | 99.94% | |
| CNG/LPG | 12.26% | 11.83% | 10.73% | CNG/LPG | 0.0% | 0.01% | 0.02% | |
| PETROL/ETHANOL | 4.59% | 4.34% | 5.43% | PETROL/ETHANOL | 0.0% | 0.00% | 0.04% | |
| EV | 1.63% | 1.56% | 1.07% | EV | 1.1% | 0.09% | 0.00% | |
| HYBRID | 0.06% | 0.05% | 0.03% | Total | 100% | 100% | 100% | |
| Total | 100% | 100% | 100% |
| Passenger Vehicle | July’25 | June’25 | July’24 | Tractor | July’25 | June’25 | July’24 | |
| PETROL/ETHANOL | 48.11% | 48.15% | 51.75% | Diesel | 99.99% | 99.99% | 99.98% | |
| Diesel | 17.75% | 18.48% | 18.36% | PETROL/ETHANOL | 0.00% | 0.01% | 0.02% | |
| CNG/LPG | 21.33% | 20.82% | 18.45% | Total | 100% | 100% | 100% | |
| HYBRID | 8.08% | 8.13% | 9.01% | |||||
| EV | 4.73% | 4.43% | 2.43% | |||||
| Total | 100% | 100% | 100% |
Source: FADA Research
All India Vehicle Retail Strength YoY and MOM comparison for July’25.
| Category | MoM% | YoY% | Category | MoM% | YoY% |
| 2W | CV | ||||
| Urban | 1.21% | -0.31% | Urban | 3.59% | 2.56% |
| Rural | -11.84% | -11.17% | Rural | 4.86% | -2.26% |
| Total | -6.28% | -6.48% | Total | 4.19% | 0.23% |
| 3W | CE | ||||
| Urban | 8.23% | -1.43% | Urban | -60.44% | -26.53% |
| Rural | 12.92% | 2.80% | Rural | -57.60% | -38.39% |
| Total | 10.73% | 0.83% | Total | -59.00% | -33.28% |
| PV | TRAC | ||||
| Urban | 11.14% | -2.52% | Urban | 19.23% | 18.23% |
| Rural | 9.16% | 2.12% | Rural | 13.93% | 9.37% |
| Total | 10.38% | -0.81% | Total | 14.90% | 10.96% |
| Total | |||||
| Urban | 3.68% | -0.52% | |||
| Rural | -6.63% | -7.53% | |||
| Total | -1.98% | -4.31% |
Source: FADA Research
Disclaimer:
- The above numbers do not have figures from TS.
- Vehicle Retail Data has been collated as on 04.08.25 in collaboration with Ministry of Road Transport & Highways, Government of India and has been gathered from 1,386 out of 1,446 RTOs.
- Commercial Vehicle is subdivided in the following manner
- LCV – Light Commercial Vehicle (incl. Passenger & Goods Vehicle)
- MCV – Medium Commercial Vehicle (incl. Passenger & Goods Vehicle)
- HCV – Heavy Commercial Vehicle (incl. Passenger & Goods Vehicle)
- Others – Construction Equipment Vehicles and others
- 3-Wheeler is sub-divided in the following manner
- E-Rickshaw – Passenger
- E-Rickshaw – Goods
- 3-Wheeler – Goods
- 3-Wheeler – Passenger
- 3-Wheeler – Personal
OEM wise Market Share Data for July’25 (YoY comparison)
| Two-Wheeler OEM | July’25 | Market Share (%) July’25 | July’24 | Market Share (%) July’24 |
| HONDA MOTORCYCLE AND SCOOTER INDIA (P) LTD | 3,45,802 | 25.51% | 3,69,980 | 25.52% |
| HERO MOTOCORP LTD | 3,39,548 | 25.05% | 4,00,093 | 27.60% |
| TVS MOTOR COMPANY LTD | 2,69,677 | 19.89% | 2,52,045 | 17.39% |
| BAJAJ AUTO LTD | 1,38,381 | 10.21% | 1,61,936 | 11.17% |
| SUZUKI MOTORCYCLE INDIA PVT LTD | 88,003 | 6.49% | 80,309 | 5.54% |
| ROYAL-ENFIELD (UNIT OF EICHER LTD) | 67,561 | 4.98% | 58,685 | 4.05% |
| INDIA YAMAHA MOTOR PVT LTD | 50,762 | 3.74% | 54,822 | 3.78% |
| OLA ELECTRIC TECHNOLOGIES PVT LTD | 17,852 | 1.32% | 41,802 | 2.88% |
| ATHER ENERGY LTD | 16,251 | 1.20% | 10,218 | 0.70% |
| GREAVES ELECTRIC MOBILITY PVT LTD | 4,199 | 0.31% | 3,159 | 0.22% |
| PIAGGIO VEHICLES PVT LTD | 2,527 | 0.19% | 3,079 | 0.21% |
| CLASSIC LEGENDS PVT LTD | 2,237 | 0.17% | 2,206 | 0.15% |
| PUR ENERGY PVT LTD | 1,688 | 0.12% | 390 | 0.03% |
| BGAUSS AUTO PRIVATE LIMITED | 1,595 | 0.12% | 1,793 | 0.12% |
| RIVER MOBILITY PVT LTD | 1,518 | 0.11% | 222 | 0.02% |
| Others Including EV | 7,903 | 0.58% | 8,748 | 0.60% |
| Total | 13,55,504 | 100% | 14,49,487 | 100% |
Source: FADA Research
Disclaimer:
- The above numbers do not have figures from TS.
- Vehicle Retail Data has been collated as on 04.08.25 in collaboration with Ministry of Road Transport & Highways, Government of India and has been gathered from 1,386 out of 1,446 RTOs.
- Others include OEMs accounting less than 0.1% Market Share.
| Three-Wheeler OEM | July’25 | Market Share(%) July’25 | July’24 | Market Share(%) July’24 |
| BAJAJ AUTO LTD | 38,704 | 34.74% | 38,730 | 35.05% |
| MAHINDRA & MAHINDRA LIMITED | 10,492 | 9.42% | 7,650 | 6.92% |
| MAHINDRA LAST MILE MOBILITY LTD | 10,482 | 9.41% | 7,545 | 6.83% |
| MAHINDRA & MAHINDRA LIMITED | 10 | 0.01% | 105 | 0.10% |
| PIAGGIO VEHICLES PVT LTD | 6,901 | 6.19% | 8,445 | 7.64% |
| TVS MOTOR COMPANY LTD | 4,279 | 3.84% | 1,982 | 1.79% |
| YC ELECTRIC VEHICLE | 3,635 | 3.26% | 3,856 | 3.49% |
| ATUL AUTO LTD | 2,365 | 2.12% | 2,376 | 2.15% |
| SAERA ELECTRIC AUTO PVT LTD | 2,207 | 1.98% | 2,573 | 2.33% |
| DILLI ELECTRIC AUTO PVT LTD | 1,920 | 1.72% | 2,268 | 2.05% |
| ENERGY ELECTRIC VEHICLES | 1,235 | 1.11% | 1,240 | 1.12% |
| Others including EV | 39,688 | 35.62% | 41,391 | 37.45% |
| Total | 1,11,426 | 100% | 1,10,511 | 100% |
Source: FADA Research
Disclaimer:
- The above numbers do not have figures from TS.
- Vehicle Retail Data has been collated as on 04.08.25 in collaboration with Ministry of Road Transport & Highways, Government of India and has been gathered from 1,386 out of 1,446 RTOs.
- Others include OEMs accounting less than 1% Market Share.
| Commercial Vehicle OEM | July’25 | Market Share (%) July’25 | July’24 | Market Share (%) July’24 |
| TATA MOTORS LTD | 25,244 | 33.03% | 27,617 | 36.21% |
| MAHINDRA & MAHINDRA LIMITED | 20,442 | 26.74% | 19,039 | 24.97% |
| MAHINDRA & MAHINDRA LIMITED | 18,950 | 24.79% | 17,578 | 23.05% |
| MAHINDRA LAST MILE MOBILITY LTD | 1,492 | 1.95% | 1,461 | 1.92% |
| ASHOK LEYLAND LTD | 14,174 | 18.54% | 13,979 | 18.33% |
| ASHOK LEYLAND LTD | 14,078 | 18.42% | 13,940 | 18.28% |
| SWITCH MOBILITY AUTOMOTIVE LTD | 96 | 0.13% | 39 | 0.05% |
| VE COMMERCIAL VEHICLES LTD | 7,125 | 9.32% | 6,689 | 8.77% |
| MARUTI SUZUKI INDIA LTD | 3,589 | 4.70% | 3,543 | 4.65% |
| FORCE MOTORS LIMITED | 1,950 | 2.55% | 1,901 | 2.49% |
| SML ISUZU LTD | 1,568 | 2.05% | 1,431 | 1.88% |
| DAIMLER INDIA COMMERCIAL VEHICLES PVT. LTD | 1,436 | 1.88% | 1,581 | 2.07% |
| Others | 911 | 1.19% | 481 | 0.63% |
| Total | 76,439 | 100.00% | 76,261 | 100.00% |
Source: FADA Research
Disclaimer:
- The above numbers do not have figures from TS.
- Vehicle Retail Data has been collated as on 04.08.25 in collaboration with Ministry of Road Transport & Highways, Government of India and has been gathered from 1,386 out of 1,446 RTOs.
- Others include OEMs accounting less than 1% Market Share.
| Construction Equipment OEM | July’25 | Market Share (%) July’25 | July’24 | Market Share (%) July’24 |
| JCB INDIA LIMITED | 1,731 | 49.33% | 2,293 | 43.60% |
| ACTION CONSTRUCTION EQUIPMENT LTD. | 401 | 11.43% | 751 | 14.28% |
| ESCORTS KUBOTA LIMITED (CONSTRUCTION EQUIPMENT) | 204 | 5.81% | 420 | 7.99% |
| AJAX ENGINEERING LTD | 190 | 5.41% | 352 | 6.69% |
| ALL TERRAIN CRANE | 176 | 5.02% | 92 | 1.75% |
| BULL MACHINES PVT LTD | 110 | 3.13% | 80 | 1.52% |
| CATERPILLAR INDIA PRIVATE LIMITED | 79 | 2.25% | 166 | 3.16% |
| MAHINDRA & MAHINDRA LIMITED | 56 | 1.60% | 82 | 1.56% |
| INDO FARM EQUIPMENT LIMITED | 50 | 1.42% | 85 | 1.62% |
| M/S SCHWING STETTER (INDIA) PRIVATE LIMITED | 43 | 1.23% | 76 | 1.45% |
| ASHOK LEYLAND LTD | 40 | 1.14% | 36 | 0.68% |
| SANY HEAVY INDUSTRY INDIA PVT LTD | 36 | 1.03% | 52 | 0.99% |
| Others | 393 | 11.20% | 774 | 14.72% |
| Total | 3,509 | 100.00% | 5,259 | 100.00% |
Source: FADA Research
Disclaimer:
- The above numbers do not have figures from TS.
- Vehicle Retail Data has been collated as on 04.08.25 in collaboration with Ministry of Road Transport & Highways, Government of India and has been gathered from 1,386 out of 1,446 RTOs.
- Others include OEMs accounting less than 1% Market Share.
| PV OEM | July’25 | Market Share (%) July’25 | July’24 | Market Share (%) July’24 |
| MARUTI SUZUKI INDIA LTD | 1,29,164 | 39.31% | 1,32,426 | 39.97% |
| HYUNDAI MOTOR INDIA LTD | 43,009 | 13.09% | 44,271 | 13.36% |
| MAHINDRA & MAHINDRA LIMITED | 42,207 | 12.84% | 39,823 | 12.02% |
| TATA MOTORS LTD | 40,486 | 12.32% | 44,621 | 13.47% |
| TOYOTA KIRLOSKAR MOTOR PVT LTD | 25,370 | 7.72% | 22,821 | 6.89% |
| KIA INDIA PRIVATE LIMITED | 19,494 | 5.93% | 19,434 | 5.87% |
| SKODA AUTO VOLKSWAGEN GROUP | 8,018 | 2.44% | 6,527 | 1.97% |
| SKODA AUTO VOLKSWAGEN INDIA PVT LTD | 7,960 | 2.42% | 6,474 | 1.95% |
| VOLKSWAGEN AG/INDIA PVT. LTD. | 38 | 0.01% | 1 | 0.00% |
| AUDI AG | 20 | 0.01% | 47 | 0.01% |
| SKODA AUTO INDIA/AS PVT LTD | – | 0.00% | 5 | 0.00% |
| JSW MG MOTOR INDIA PVT LTD | 6,033 | 1.84% | 4,114 | 1.24% |
| HONDA CARS INDIA LTD | 4,431 | 1.35% | 5,035 | 1.52% |
| RENAULT INDIA PVT LTD | 2,292 | 0.70% | 3,124 | 0.94% |
| NISSAN MOTOR INDIA PVT LTD | 1,514 | 0.46% | 1,878 | 0.57% |
| MERCEDES -BENZ GROUP | 1,306 | 0.40% | 1,268 | 0.38% |
| MERCEDES-BENZ INDIA PVT LTD | 1,188 | 0.36% | 1,183 | 0.36% |
| MERCEDES -BENZ AG | 104 | 0.03% | 79 | 0.02% |
| DAIMLER AG | 14 | 0.00% | 6 | 0.00% |
| BMW INDIA PVT LTD | 1,301 | 0.40% | 1,164 | 0.35% |
| FORCE MOTORS LIMITED | 729 | 0.22% | 920 | 0.28% |
| PCA AUTOMOBILES INDIA PVT LTD | 512 | 0.16% | 472 | 0.14% |
| JAGUAR LAND ROVER INDIA LIMITED | 478 | 0.15% | 529 | 0.16% |
| BYD INDIA PRIVATE LIMITED | 459 | 0.14% | 356 | 0.11% |
| Others | 1,810 | 0.55% | 2,497 | 0.75% |
| Total | 3,28,613 | 100% | 3,31,280 | 100% |
Source: FADA Research
Disclaimer:
- The above numbers do not have figures from TS.
- Vehicle Retail Data has been collated as on 04.08.25 in collaboration with Ministry of Road Transport & Highways, Government of India and has been gathered from 1,386 out of 1,446 RTOs.
| Tractor OEM | July’25 | Market Share (%) July’25 | July’24 | Market Share (%) July’24 |
| MAHINDRA & MAHINDRA LIMITED (TRACTOR) | 20,610 | 23.23% | 18,436 | 23.06% |
| MAHINDRA & MAHINDRA LIMITED (SWARAJ DIVISION) | 16,725 | 18.85% | 16,267 | 20.34% |
| INTERNATIONAL TRACTORS LIMITED | 12,536 | 14.13% | 11,147 | 13.94% |
| TAFE LIMITED | 9,649 | 10.88% | 7,871 | 9.84% |
| ESCORTS KUBOTA LIMITED (AGRI MACHINERY GROUP) | 9,196 | 10.36% | 8,273 | 10.35% |
| JOHN DEERE INDIA PVT LTD (TRACTOR DEVISION) | 7,027 | 7.92% | 6,237 | 7.80% |
| EICHER TRACTORS | 6,166 | 6.95% | 5,417 | 6.77% |
| CNH INDUSTRIAL (INDIA) PVT LTD | 3,872 | 4.36% | 3,016 | 3.77% |
| KUBOTA AGRICULTURAL MACHINERY INDIA PVT.LTD. | 569 | 0.64% | 1,462 | 1.83% |
| Others | 2,372 | 2.67% | 1,835 | 2.29% |
| Total | 88,722 | 100% | 79,961 | 100% |
Source: FADA Research
Disclaimer:
- The above numbers do not have figures from TS.
- Vehicle Retail Data has been collated as on 04.08.25 in collaboration with Ministry of Road Transport & Highways, Government of India and has been gathered from 1,386 out of 1,446 RTOs.
- Others include OEMs accounting less than 1% Market Share.