

New Delhi, 5th July 2024 – The Federation of Automobile Dealers Associations (FADA) has published its vehicle retail data for June 2024, revealing a mixed performance across various segments in the Indian auto retail sector.
Modest Overall Growth
The Indian auto retail market saw a slight year-on-year (YoY) growth of 0.73%. This modest increase highlights the challenges faced by different vehicle categories amidst varying economic and environmental conditions.
Segment Performance
- Two-Wheelers (2W): This segment showed a positive YoY growth of 4.66%, despite facing significant challenges such as extreme heat and stalled monsoons, which resulted in a 13% decrease in walk-ins and a month-on-month (MoM) sales decline of 10.36%.
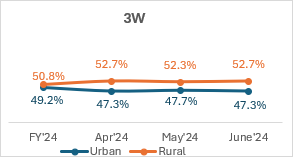
- Three-Wheelers (3W): The three-wheeler segment experienced a YoY increase of 5.1%, indicating steady demand.
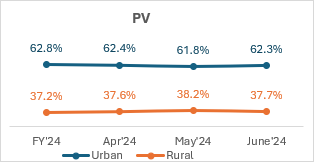
- Passenger Vehicles (PV): Sales in this category declined by 6.77% YoY and 7.18% MoM. High inventory levels, ranging from 62 to 67 days, and subdued market sentiment due to extreme weather conditions and delayed monsoons contributed to this decline.
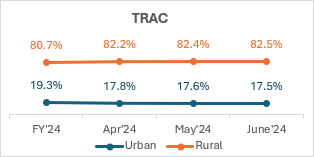
- Tractors (Trac): This segment faced the most significant drop, with a YoY decline of 28.3%, reflecting the adverse impact of extreme heat and delayed monsoons on rural sales.
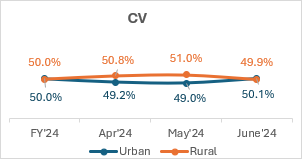
- Commercial Vehicles (CV): Sales decreased by 4.74% YoY and 12.42% MoM, affected by poor market sentiment and delayed purchases due to low demand and funding delays.
Challenges Identified
FADA highlighted several challenges impacting the auto retail sector:
- Extreme heat and delayed monsoons negatively affected rural sales.
- High inventory levels, particularly in the PV segment, strained dealers financially due to high interest costs.
- Low customer inquiries and postponed purchases were prevalent across segments.
FADA’s Recommendations
To address these challenges, FADA advised PV Original Equipment Manufacturers (OEMs) to implement prudent inventory control and proactive market engagement to alleviate financial strain on dealers.
New Research Initiative
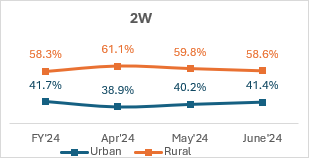
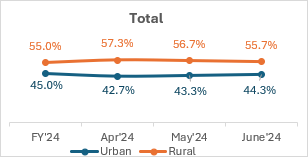
FADA has initiated the release of retail sales data based on the urban and rural split, offering deeper insights into market performance. This analysis is expected to provide valuable indicators of economic conditions and micro-market performance.
Near-Term Outlook
Looking ahead, the southwest monsoon has covered the entire country ahead of schedule, boosting prospects for kharif sowing. The new government’s increase in Minimum Support Prices (MSPs) for kharif crops is expected to enhance rural disposable income, potentially improving auto retail performance.
Improved product availability and substantial discounts aimed at stimulating demand are anticipated to support future growth. However, dealer feedback indicates cautious optimism, with concerns over low customer inquiries and heavy rains impacting market sentiment.
Overall, the auto retail sector’s outlook for July 2024 is cautiously optimistic, with a moderate growth expectation tempered by persistent challenges.
Key Findings from FADA’s Online Members Survey
- Liquidity: 46.37% Neutral, 27.82% Bad, 25.81% Good
- Sentiment: 49.60% Neutral, 26.21% Bad, 24.19% Good
- Expectation for July 2024: 41.53% De-growth, 35.89% Growth, 22.58% Flat
The mixed performance in June 2024 highlights the complexities of the Indian auto retail market. FADA’s detailed analysis and strategic recommendations aim to guide the industry through these challenging times, fostering a cautiously optimistic outlook for the coming months.
Chart showing Vehicle Retail Data for June’24
All India Vehicle Retail Data for June’24
| CATEGORY | June’24 | May’24 | June’23 | MoM% | YoY% |
| 2W | 13,75,889 | 15,34,856 | 13,14,628 | -10.36% | 4.66% |
| 3W | 94,321 | 98,265 | 89,743 | -4.01% | 5.10% |
| E-RICKSHAW(P) | 37,963 | 39,505 | 39,050 | -3.90% | -2.78% |
| E-RICKSHAW WITH CART (G) | 4,612 | 5,530 | 2,889 | -16.60% | 59.64% |
| THREE-WHEELER (GOODS) | 8,959 | 9,927 | 8,669 | -9.75% | 3.35% |
| THREE-WHEELER (PASSENGER) | 42,690 | 43,224 | 39,060 | -1.24% | 9.29% |
| THREE-WHEELER (PERSONAL) | 97 | 79 | 75 | 22.78% | 29.33% |
| PV | 2,81,566 | 3,03,358 | 3,02,000 | -7.18% | -6.77% |
| TRAC | 71,029 | 70,065 | 99,148 | 1.38% | -28.36% |
| CV | 72,747 | 83,059 | 76,364 | -12.42% | -4.74% |
| LCV | 40,711 | 45,712 | 43,523 | -10.94% | -6.46% |
| MCV | 6,872 | 6,871 | 6,513 | 0.01% | 5.51% |
| HCV | 21,546 | 26,306 | 22,904 | -18.09% | -5.93% |
| Others | 3,618 | 4,170 | 3,424 | -13.24% | 5.67% |
| Total | 18,95,552 | 20,89,603 | 18,81,883 | -9.29% | 0.73% |
Source: FADA Research
All India Vehicle Retail Strength Index for June’24 on basis of Urban & Rural RTOs.
Motor Vehicle Road Tax Collection (in Rs Crore)
| June’24 | May’24 | June’23 | MoM% | YoY% | |
| Motor Vehicle Road Tax Collection | 6,046 | 6,727 | 5,854 | -10.1% | 3.3% |
Source: FADA Research
Disclaimer:
- The above numbers do not have figures from TS & LD.
- Vehicle Retail Data has been collated as on 03.07.24 in collaboration with Ministry of Road Transport & Highways, Government of India and has been gathered from 1,567 out of 1,700 RTOs.
- Commercial Vehicle is subdivided in the following manner
- LCV – Light Commercial Vehicle (incl. Passenger & Goods Vehicle)
- MCV – Medium Commercial Vehicle (incl. Passenger & Goods Vehicle)
- HCV – Heavy Commercial Vehicle (incl. Passenger & Goods Vehicle)
- Others – Construction Equipment Vehicles and others
- 3-Wheeler is sub-divided in the following manner
- E-Rickshaw – Passenger
- E-Rickshaw – Goods
- 3-Wheeler – Goods
- 3-Wheeler – Passenger
- 3-Wheeler – Personal
OEM wise Market Share Data for the Month of June’24 with YoY comparison
| Two-Wheeler OEM | JUN’24 | Market Share (%) JUN’24 | JUN’23 | Market Share (%) JUN’23 |
| HERO MOTOCORP LTD | 3,97,029 | 28.86% | 4,27,203 | 32.50% |
| HONDA MOTORCYCLE AND SCOOTER INDIA (P) LTD | 3,51,422 | 25.54% | 2,83,398 | 21.56% |
| TVS MOTOR COMPANY LTD | 2,36,180 | 17.17% | 2,27,163 | 17.28% |
| BAJAJ AUTO GROUP | 1,53,535 | 11.16% | 1,63,536 | 12.44% |
| BAJAJ AUTO LTD | 1,53,535 | 11.16% | 1,63,533 | 12.44% |
| CHETAK TECHNOLOGY LIMITED | – | 0.00% | 3 | 0.00% |
| SUZUKI MOTORCYCLE INDIA PVT LTD | 73,048 | 5.31% | 62,682 | 4.77% |
| ROYAL-ENFIELD (UNIT OF EICHER LTD) | 55,249 | 4.02% | 62,374 | 4.74% |
| INDIA YAMAHA MOTOR PVT LTD | 50,106 | 3.64% | 46,909 | 3.57% |
| OLA ELECTRIC TECHNOLOGIES PVT LTD | 36,723 | 2.67% | 17,692 | 1.35% |
| ATHER ENERGY PVT LTD | 6,104 | 0.44% | 4,603 | 0.35% |
| GREAVES ELECTRIC MOBILITY PVT LTD | 2,713 | 0.20% | 1,440 | 0.11% |
| PIAGGIO VEHICLES PVT LTD | 2,669 | 0.19% | 2,716 | 0.21% |
| CLASSIC LEGENDS PVT LTD | 2,033 | 0.15% | 2,618 | 0.20% |
| Others Including EV | 9,078 | 0.66% | 12,294 | 0.94% |
| Total | 13,75,889 | 100% | 13,14,628 | 100% |
Source: FADA Research
Disclaimer:
1- The above numbers do not have figures from TS & LD.
2- Vehicle Retail Data has been collated as on 03.07.24 in collaboration with Ministry of Road Transport & Highways, Government of India and has been gathered from 1,567 out of 1,700 RTOs.
3- Others include OEMs accounting less than 0.1% Market Share.
| Three-Wheeler OEM | JUN’24 | Market Share (%) JUN’24 | JUN’23 | Market Share (%) JUN’23 |
| BAJAJ AUTO LTD | 34,238 | 36.30% | 33,264 | 37.07% |
| PIAGGIO VEHICLES PVT LTD | 6,850 | 7.26% | 6,178 | 6.88% |
| MAHINDRA & MAHINDRA LIMITED | 5,449 | 5.78% | 5,257 | 5.86% |
| MAHINDRA LAST MILE MOBILITY LTD | 5,353 | 5.68% | – | 0.00% |
| MAHINDRA & MAHINDRA LIMITED | 96 | 0.10% | 5,257 | 5.86% |
| MAHINDRA REVA ELECTRIC VEHICLES PVT LTD | – | 0.00% | – | 0.00% |
| YC ELECTRIC VEHICLE | 3,355 | 3.56% | 3,471 | 3.87% |
| SAERA ELECTRIC AUTO PVT LTD | 2,471 | 2.62% | 2,363 | 2.63% |
| ATUL AUTO LTD | 2,022 | 2.14% | 1,640 | 1.83% |
| DILLI ELECTRIC AUTO PVT LTD | 1,963 | 2.08% | 2,140 | 2.38% |
| TVS MOTOR COMPANY LTD | 1,746 | 1.85% | 1,422 | 1.58% |
| MINI METRO EV L.L.P | 1,296 | 1.37% | 1,504 | 1.68% |
| UNIQUE INTERNATIONAL | 1,174 | 1.24% | 1,162 | 1.29% |
| ENERGY ELECTRIC VEHICLES | 1,069 | 1.13% | 833 | 0.93% |
| HOTAGE INDIA | 1,033 | 1.10% | 1,234 | 1.38% |
| J. S. AUTO (P) LTD | 973 | 1.03% | 984 | 1.10% |
| Others including EV | 30,682 | 32.53% | 28,291 | 31.52% |
| Total | 94,321 | 100% | 89,743 | 100% |
Source: FADA Research
Disclaimer:
- The above numbers do not have figures from TS & LD.
- Vehicle Retail Data has been collated as on 03.07.24 in collaboration with Ministry of Road Transport & Highways, Government of India and has been gathered from 1,567 out of 1,700 RTOs.
- Others include OEMs accounting less than 1% Market Share.
| Commercial Vehicle OEM | JUN’24 | Market Share (%) JUN’24 | JUN’23 | Market Share (%) JUN’23 |
| TATA MOTORS LTD | 25,919 | 35.63% | 26,799 | 35.09% |
| MAHINDRA & MAHINDRA LIMITED | 17,468 | 24.01% | 16,938 | 22.18% |
| ASHOK LEYLAND LTD | 11,257 | 15.47% | 12,696 | 16.63% |
| VE COMMERCIAL VEHICLES LTD | 5,872 | 8.07% | 6,135 | 8.03% |
| MARUTI SUZUKI INDIA LTD | 2,883 | 3.96% | 3,483 | 4.56% |
| FORCE MOTORS LIMITED | 1,507 | 2.07% | 1,625 | 2.13% |
| DAIMLER INDIA COMMERCIAL VEHICLES PVT. LTD | 1,499 | 2.06% | 1,575 | 2.06% |
| SML ISUZU LTD | 1,497 | 2.06% | 1,265 | 1.66% |
| Others | 4,845 | 6.66% | 5,848 | 7.66% |
| Total | 72,747 | 100.00% | 76,364 | 100.00% |
Source: FADA Research
Disclaimer:
1- The above numbers do not have figures from TS & LD.
2- Vehicle Retail Data has been collated as on 03.07.24 in collaboration with Ministry of Road Transport & Highways, Government of India and has been gathered from 1,567 out of 1,700 RTOs.
| PV OEM | JUN’24 | Market Share (%) JUN’24 | JUN’23 | Market Share (%) JUN’23 |
| MARUTI SUZUKI INDIA LTD | 1,13,575 | 40.34% | 1,22,801 | 40.66% |
| HYUNDAI MOTOR INDIA LTD | 38,046 | 13.51% | 44,104 | 14.60% |
| TATA MOTORS LTD | 37,242 | 13.23% | 40,428 | 13.39% |
| MAHINDRA & MAHINDRA LIMITED | 34,958 | 12.42% | 31,398 | 10.40% |
| TOYOTA KIRLOSKAR MOTOR PVT LTD | 18,297 | 6.50% | 16,689 | 5.53% |
| KIA INDIA PRIVATE LIMITED | 16,158 | 5.74% | 17,138 | 5.67% |
| SKODA AUTO VOLKSWAGEN GROUP | 5,418 | 1.92% | 6,949 | 2.30% |
| SKODA AUTO VOLKSWAGEN INDIA PVT LTD | 5,375 | 1.91% | 6,819 | 2.26% |
| VOLKSWAGEN AG/INDIA PVT. LTD. | – | 0.00% | – | 0.00% |
| AUDI AG | 43 | 0.02% | 129 | 0.04% |
| SKODA AUTO INDIA/AS PVT LTD | – | 0.00% | 1 | 0.00% |
| HONDA CARS INDIA LTD | 4,178 | 1.48% | 4,739 | 1.57% |
| MG MOTOR INDIA PVT LTD | 3,675 | 1.31% | 4,461 | 1.48% |
| RENAULT INDIA PVT LTD | 2,961 | 1.05% | 4,313 | 1.43% |
| NISSAN MOTOR INDIA PVT LTD | 1,559 | 0.55% | 2,216 | 0.73% |
| MERCEDES -BENZ GROUP | 1,149 | 0.41% | 1,072 | 0.35% |
| MERCEDES-BENZ INDIA PVT LTD | 1,055 | 0.37% | 981 | 0.32% |
| MERCEDES -BENZ AG | 80 | 0.03% | 88 | 0.03% |
| DAIMLER AG | 14 | 0.00% | 3 | 0.00% |
| BMW INDIA PVT LTD | 968 | 0.34% | 1,029 | 0.34% |
| FORCE MOTORS LIMITED | 659 | 0.23% | 514 | 0.17% |
| PCA AUTOMOBILES INDIA PVT LTD | 515 | 0.18% | 878 | 0.29% |
| JAGUAR LAND ROVER INDIA LIMITED | 295 | 0.10% | 300 | 0.10% |
| FCA INDIA AUTOMOBILES PRIVATE LIMITED | 285 | 0.10% | 583 | 0.19% |
| BYD INDIA PRIVATE LIMITED | 229 | 0.08% | 185 | 0.06% |
| VOLVO AUTO INDIA PVT LTD | 137 | 0.05% | 155 | 0.05% |
| Others | 1,262 | 0.45% | 2,048 | 0.68% |
| Total | 2,81,566 | 100% | 3,02,000 | 100% |
Source: FADA Research
Disclaimer:
1. The above numbers do not have figures from TS & LD.
2. Vehicle Retail Data has been collated as on 03.07.24 in collaboration with Ministry of Road Transport & Highways, Government of India and has been gathered from 1,567 out of 1,700 RTOs.
| Tractor OEM | JUN’24 | Market Share (%) JUN’24 | JUN’23 | Market Share (%) JUN’23 |
| MAHINDRA & MAHINDRA LIMITED (TRACTOR) | 16,333 | 22.99% | 21,646 | 21.83% |
| MAHINDRA & MAHINDRA LIMITED (SWARAJ DIVISION) | 13,283 | 18.70% | 15,997 | 16.13% |
| INTERNATIONAL TRACTORS LIMITED | 9,244 | 13.01% | 12,759 | 12.87% |
| TAFE LIMITED | 8,646 | 12.17% | 11,201 | 11.30% |
| ESCORTS KUBOTA LIMITED (AGRI MACHINERY GROUP) | 7,536 | 10.61% | 10,215 | 10.30% |
| JOHN DEERE INDIA PVT LTD (TRACTOR DEVISION) | 5,520 | 7.77% | 8,291 | 8.36% |
| EICHER TRACTORS | 4,625 | 6.51% | 4,983 | 5.03% |
| CNH INDUSTRIAL (INDIA) PVT LTD | 2,863 | 4.03% | 5,572 | 5.62% |
| KUBOTA AGRICULTURAL MACHINERY INDIA PVT.LTD. | 1,218 | 1.71% | 1,733 | 1.75% |
| Others | 1,761 | 2.48% | 6,751 | 6.81% |
| Total | 71,029 | 100% | 99,148 | 100% |
Source: FADA Research
Disclaimer:
1- The above numbers do not have figures from TS & LD.
2- Vehicle Retail Data has been collated as on 03.07.24 in collaboration with Ministry of Road Transport & Highways, Government of India and has been gathered from 1,567 out of 1,700 RTOs.