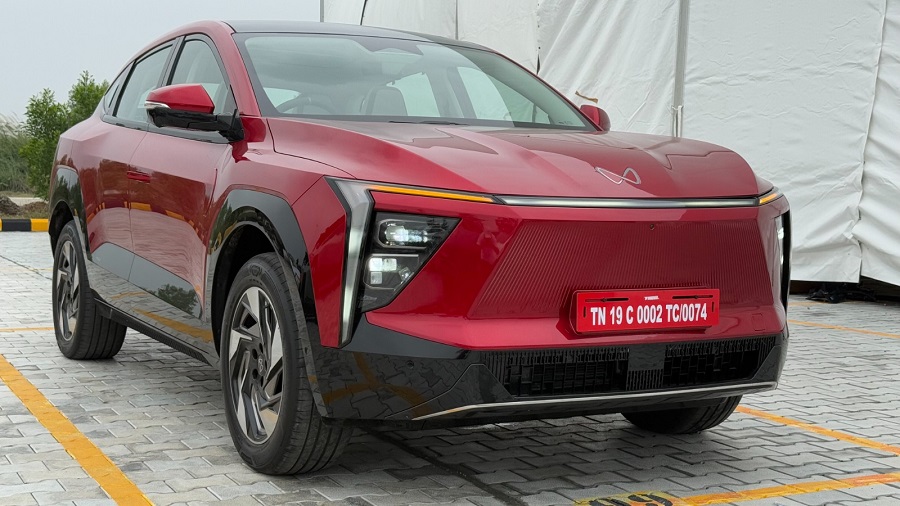
Mumbai – Mahindra & Mahindra Ltd. (M&M Ltd.) is cruising comfortably in the fast lane. The SUV giant clocked in an impressive 47,306 domestic SUV sales in June 2025, registering a muscular 18% year-on-year growth, all while casually racking up total volumes of 78,969 units, including exports and commercial vehicles — a solid 14% jump over June 2024.
And if you thought June was just another gear in the machine, think again — it capped off what Mahindra calls its “highest-ever SUV quarter”. Apparently, the XUVs, Scorpios, Thars and Boleros aren’t just climbing mountains — they’re also scaling the sales charts.
“In June, we achieved SUV sales of 47,306 units, a growth of 18%, and total vehicle sales of 78,969 units, a 14% growth compared to the same month last year,” said Nalinikanth Gollagunta, CEO, Automotive Division, M&M Ltd. “The quarter ended on a very positive note for us, marking the highest quarter ever for SUVs.”
Meanwhile, over in the Commercial Vehicles pit lane, Mahindra added another 20,575 units to its tally — because why settle for just being king of the hill, when you can also rule the highways, logistics hubs, and construction sites?
Not to be outdone, Mahindra also managed to export a few thousand SUVs, spreading some made-in-India muscle to global roads. International buyers, it seems, can’t resist a good dose of torque and street presence either.
Mahindra is clearly not just riding the SUV wave — it is the wave. With consistent growth, robust domestic demand, and record-breaking quarters, the brand continues to prove that when it comes to SUVs, the road might have traffic — but Mahindra’s always got the right of way.
| Passenger Vehicles Sales Summary (Domestic) – June 2025 | ||||||
| Category | June | YTD June | ||||
| F26 | F25 | % Change | F26 | F25 | % Change | |
| Utility Vehicles* | 47306 | 40022 | 18% | 152067 | 124248 | 22% |
| Cars + Vans | 0 | 0 | ||||
| Passenger Vehicles | 47306 | 40022 | 18% | 152067 | 124248 | 22% |
| Commercial Vehicles and 3 Wheelers Sales Summary (Domestic) – June 2025 | ||||||
| Category | June | YTD June | ||||
| F26 | F25 | % Change | F26 | F25 | % Change | |
| LCV < 2T** | 2576 | 3227 | -20% | 7808 | 9755 | -20% |
| LCV 2 T – 3.5 T*** | 16772 | 16152 | 4% | 53631 | 49377 | 9% |
| LCV > 3.5T + MHCV | 1227 | 1219 | 1% | 3517 | 3394 | 4% |
| 3 Wheelers (including electric 3Ws)** | 8454 | 6180 | 37% | 20559 | 17651 | 16% |
| Exports – June 2025 | ||||||
| Category | June | YTD June | ||||
| F26 | F25 | % Change | F26 | F25 | % Change | |
| Total Exports** | 2634 | 2597 | 1% | 9667 | 7125 | 36% |


