
New Delhi, 5th September 2024 – India’s auto retail sector saw modest growth in August 2024, but the industry faces mounting challenges, particularly from unpredictable weather patterns and rising inventory. The Federation of Automobile Dealers Associations (FADA) released its August 2024 vehicle retail data, showing a mixed performance across segments, with a Year-on-Year (YoY) growth of 2.88%. However, key sectors like passenger vehicles (PVs) and commercial vehicles (CVs) recorded declines, prompting concerns about the broader market outlook.
Segment-Wise Performance: A Mixed Bag
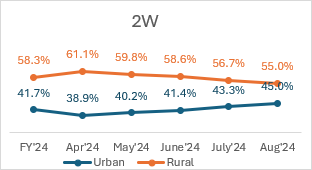
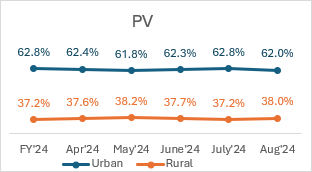
While the two-wheeler (2W) segment posted a YoY growth of 6.28%, monthly comparisons paint a more cautious picture. The 2W market saw a 7.29% decline in sales compared to July, with experts attributing this to disruptive rainfall and market saturation. Passenger vehicles, typically a strong performer, experienced a 4.53% drop YoY and a 3.46% decline Month-on-Month (MoM), reflecting consumer hesitation and weather-induced delays in purchases.
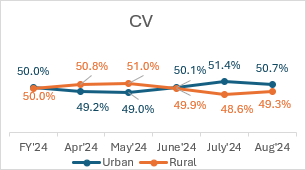
Commercial vehicles were hit the hardest, with an 8.5% MoM drop and a 6.05% YoY decline, driven by weak industrial demand and adverse weather conditions, including heavy rains and floods in several parts of the country.
Weather Takes a Toll
India’s excessive rainfall, with a 15.9% surplus in August, exacerbated challenges across the auto retail sector. Key regions like northwest India saw a 31.4% surplus in rainfall, while central India had 17.2% more than usual, severely disrupting both supply chains and consumer demand.
“The combination of delayed monsoons and sudden heavy rainfall across the country has impacted footfall and demand,” said FADA President, Manish Raj Singhania. “Flood-like conditions in several areas also postponed purchases, especially in rural markets.”
Inventory Concerns: Dealers Sound the Alarm
High inventory levels are becoming a critical issue in the PV segment. Dealerships are grappling with inventory stockpiles that now stand at 7.8 lakh vehicles, worth an estimated ₹77,800 crore. This excess stock is putting immense pressure on dealers’ cash flows, as aggressive dispatches from original equipment manufacturers (OEMs) continue despite sluggish market demand.
In response, FADA has called on banks and non-banking financial companies (NBFCs) to control funding for dealerships carrying excessive stock. The organization also urged OEMs to recalibrate their supply strategies to avoid further strain on the auto retail ecosystem.
Near-Term Outlook: Festive Hopes Amid Ongoing Challenges
As India approaches the festive season, there’s cautious optimism in the market. Festivals like Ganesh Chaturthi, Onam, and Navratri are expected to bring a boost in consumer sentiment, particularly in urban areas. Additionally, some regions with favorable rainfall are likely to see a recovery in rural demand, especially once the monsoon subsides.
However, challenges remain. The Indian Meteorological Department (IMD) has forecast continued heavy rains through September, potentially harming crops and reducing rural purchasing power. The Shraddh period, traditionally considered inauspicious for purchases, is also expected to temporarily stall sales in the PV segment.
Dealer Sentiment: A Market on Edge
Survey data from FADA’s online members showed mixed feelings about the market. Liquidity concerns were prevalent, with 51.6% of respondents describing their cash flow situation as neutral and 27.2% characterizing it as bad. Sentiment toward market performance was similarly divided, with only 25.6% reporting positive outlooks.
Despite these challenges, 50% of dealers expect growth in September, buoyed by the festive season and hopes for a rebound in rural markets.
Cautiously Optimistic
While the Indian auto retail sector faces significant hurdles, particularly from erratic weather and high inventory levels, the upcoming festive season offers a potential lifeline. Strategic inventory management and targeted marketing will be key in capitalizing on these opportunities while mitigating the risks posed by weather and economic uncertainties.
| Urban | Rural | |||
| CATEGORY | MoM% | YoY% | MoM% | YoY% |
| 2W | 3.99% | -4.80% | -3.04% | 4.00% |
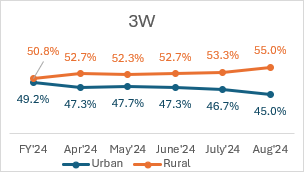
| 3W | -3.68% | -7.00% | 3.22% | 7.06% |
| CV | -1.36% | -0.16% | 1.43% | 0.17% |
| PV | -1.21% | -2.70% | 2.05% | 4.91% |
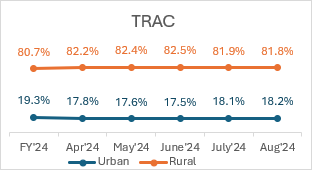
| TRAC | 1.06% | -12.48% | -0.23% | 3.24% |
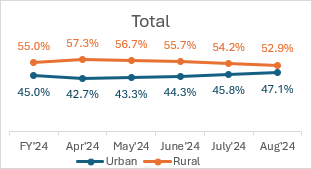
| Total | 2.64% | -5.12% | -2.24% | 4.79% |
Source: FADA Research
Motor Vehicle Road Tax Collection (in Rs Crore)
| Aug’24 | July’24 | Aug’23 | MoM% | YoY% | |
| Motor Vehicle Road Tax Collection | 6,725 | 6,995 | 6,240 | -3.9% | 7.8% |
Source: FADA Research
Disclaimer:
- The above numbers do not have figures from TS & LD.
- Vehicle Retail Data has been collated as on 03.09.24 in collaboration with Ministry of Road Transport & Highways, Government of India and has been gathered from 1,365 out of 1,429 RTOs.
- Commercial Vehicle is subdivided in the following manner
- LCV – Light Commercial Vehicle (incl. Passenger & Goods Vehicle)
- MCV – Medium Commercial Vehicle (incl. Passenger & Goods Vehicle)
- HCV – Heavy Commercial Vehicle (incl. Passenger & Goods Vehicle)
- Others – Construction Equipment Vehicles and others
- 3-Wheeler is sub-divided in the following manner
- E-Rickshaw – Passenger
- E-Rickshaw – Goods
- 3-Wheeler – Goods
- 3-Wheeler – Passenger
- 3-Wheeler – Personal
OEM wise Market Share Data for the Month of Aug’24 with YoY comparison
| Two-Wheeler OEM | AUG’24 | Market Share (%) AUG’24 | AUG’23 | Market Share (%) AUG’23 |
| HERO MOTOCORP LTD | 3,58,616 | 26.80% | 3,48,613 | 27.69% |
| HONDA MOTORCYCLE AND SCOOTER INDIA (P) LTD | 3,52,605 | 26.35% | 3,11,026 | 24.70% |
| TVS MOTOR COMPANY LTD | 2,36,597 | 17.68% | 2,25,576 | 17.92% |
| BAJAJ AUTO GROUP | 1,49,031 | 11.14% | 1,48,516 | 11.80% |
| BAJAJ AUTO LTD | 1,49,031 | 11.14% | 1,48,508 | 11.79% |
| CHETAK TECHNOLOGY LIMITED | – | 0.00% | 8 | 0.00% |
| SUZUKI MOTORCYCLE INDIA PVT LTD | 79,307 | 5.93% | 69,492 | 5.52% |
| ROYAL-ENFIELD (UNIT OF EICHER LTD) | 54,810 | 4.10% | 59,612 | 4.73% |
| INDIA YAMAHA MOTOR PVT LTD | 51,996 | 3.89% | 49,937 | 3.97% |
| OLA ELECTRIC TECHNOLOGIES PVT LTD | 27,517 | 2.06% | 18,750 | 1.49% |
| ATHER ENERGY PVT LTD | 10,830 | 0.81% | 7,157 | 0.57% |
| GREAVES ELECTRIC MOBILITY PVT LTD | 2,816 | 0.21% | 2,926 | 0.23% |
| PIAGGIO VEHICLES PVT LTD | 2,712 | 0.20% | 3,001 | 0.24% |
| CLASSIC LEGENDS PVT LTD | 2,058 | 0.15% | 2,369 | 0.19% |
| Others Including EV | 9,342 | 0.70% | 12,165 | 0.97% |
| Total | 13,38,237 | 100% | 12,59,140 | 100% |
Source: FADA Research
Disclaimer:
- The above numbers do not have figures from TS & LD.
- Vehicle Retail Data has been collated as on 03.09.24 in collaboration with Ministry of Road Transport & Highways, Government of India and has been gathered from 1,365 out of 1,429 RTOs.
- Others include OEMs accounting less than 0.1% Market Share.
| Three-Wheeler OEM | AUG’24 | Market Share (%) AUG’24 | AUG’23 | Market Share (%) AUG’23 |
| BAJAJ AUTO LTD | 37,760 | 35.80% | 36,328 | 35.00% |
| PIAGGIO VEHICLES PVT LTD | 7,378 | 6.99% | 8,348 | 8.04% |
| MAHINDRA & MAHINDRA LIMITED | 5,740 | 5.44% | 6,130 | 5.91% |
| MAHINDRA LAST MILE MOBILITY LTD | 5,669 | 5.37% | – | 0.00% |
| MAHINDRA & MAHINDRA LIMITED | 71 | 0.07% | 6,130 | 5.91% |
| MAHINDRA REVA ELECTRIC VEHICLES PVT LTD | – | 0.00% | – | 0.00% |
| YC ELECTRIC VEHICLE | 3,794 | 3.60% | 3,987 | 3.84% |
| SAERA ELECTRIC AUTO PVT LTD | 2,806 | 2.66% | 2,856 | 2.75% |
| TVS MOTOR COMPANY LTD | 2,242 | 2.13% | 1,538 | 1.48% |
| DILLI ELECTRIC AUTO PVT LTD | 2,207 | 2.09% | 2,720 | 2.62% |
| ATUL AUTO LTD | 2,102 | 1.99% | 1,719 | 1.66% |
| MINI METRO EV L.L.P | 1,338 | 1.27% | 1,701 | 1.64% |
| ENERGY ELECTRIC VEHICLES | 1,306 | 1.24% | 1,067 | 1.03% |
| HOTAGE INDIA | 1,271 | 1.20% | 1,338 | 1.29% |
| UNIQUE INTERNATIONAL | 1,170 | 1.11% | 1,447 | 1.39% |
| J. S. AUTO (P) LTD | 1,091 | 1.03% | 1,102 | 1.06% |
| ALLFINE INDUSTRIES PVT LTD | 1,064 | 1.01% | 963 | 0.93% |
| Others including EV | 34,209 | 32.43% | 32,538 | 31.35% |
| Total | 1,05,478 | 100% | 1,03,782 | 100% |
Source: FADA Research
Disclaimer:
- The above numbers do not have figures from TS & LD.
- Vehicle Retail Data has been collated as on 03.09.24 in collaboration with Ministry of Road Transport & Highways, Government of India and has been gathered from 1,365 out of 1,429 RTOs.
- Others include OEMs accounting less than 1% Market Share.
| Commercial Vehicle OEM | AUG’24 | Market Share (%) AUG’24 | AUG’23 | Market Share (%) AUG’23 |
| TATA MOTORS LTD | 24,817 | 33.88% | 28,198 | 36.17% |
| MAHINDRA & MAHINDRA LIMITED | 18,466 | 25.21% | 19,216 | 24.65% |
| ASHOK LEYLAND LTD | 11,955 | 16.32% | 12,136 | 15.57% |
| VE COMMERCIAL VEHICLES LTD | 6,173 | 8.43% | 5,717 | 7.33% |
| MARUTI SUZUKI INDIA LTD | 3,441 | 4.70% | 3,277 | 4.20% |
| DAIMLER INDIA COMMERCIAL VEHICLES PVT. LTD | 1,482 | 2.02% | 1,503 | 1.93% |
| FORCE MOTORS LIMITED | 1,379 | 1.88% | 1,527 | 1.96% |
| SML ISUZU LTD | 900 | 1.23% | 895 | 1.15% |
| Others | 4,640 | 6.33% | 5,498 | 7.05% |
| Total | 73,253 | 100.00% | 77,967 | 100.00% |
Source: FADA Research
Disclaimer:
- The above numbers do not have figures from TS & LD.
- Vehicle Retail Data has been collated as on 03.09.24 in collaboration with Ministry of Road Transport & Highways, Government of India and has been gathered from 1,365 out of 1,429 RTOs.
| PV OEM | AUG’24 | Market Share (%) AUG’24 | AUG’23 | Market Share (%) AUG’23 |
| MARUTI SUZUKI INDIA LTD | 1,24,164 | 40.18% | 1,35,675 | 41.91% |
| HYUNDAI MOTOR INDIA LTD | 42,091 | 13.62% | 48,297 | 14.92% |
| TATA MOTORS LTD | 38,788 | 12.55% | 39,854 | 12.31% |
| MAHINDRA & MAHINDRA LIMITED | 38,493 | 12.46% | 32,491 | 10.04% |
| TOYOTA KIRLOSKAR MOTOR PVT LTD | 21,854 | 7.07% | 18,240 | 5.63% |
| KIA INDIA PRIVATE LIMITED | 18,503 | 5.99% | 18,962 | 5.86% |
| SKODA AUTO VOLKSWAGEN GROUP | 5,902 | 1.91% | 8,003 | 2.47% |
| SKODA AUTO VOLKSWAGEN INDIA PVT LTD | 5,881 | 1.90% | 7,911 | 2.44% |
| VOLKSWAGEN AG/INDIA PVT. LTD. | – | 0.00% | 3 | 0.00% |
| AUDI AG | 20 | 0.01% | 88 | 0.03% |
| SKODA AUTO INDIA/AS PVT LTD | 1 | 0.00% | 1 | 0.00% |
| HONDA CARS INDIA LTD | 4,727 | 1.53% | 4,743 | 1.47% |
| MG MOTOR INDIA PVT LTD | 3,890 | 1.26% | 4,286 | 1.32% |
| RENAULT INDIA PVT LTD | 2,990 | 0.97% | 3,986 | 1.23% |
| NISSAN MOTOR INDIA PVT LTD | 1,947 | 0.63% | 2,017 | 0.62% |
| MERCEDES -BENZ GROUP | 1,234 | 0.40% | 1,111 | 0.34% |
| MERCEDES-BENZ INDIA PVT LTD | 1,146 | 0.37% | 1,015 | 0.31% |
| MERCEDES -BENZ AG | 79 | 0.03% | 88 | 0.03% |
| DAIMLER AG | 9 | 0.00% | 8 | 0.00% |
| BMW INDIA PVT LTD | 921 | 0.30% | 1,109 | 0.34% |
| FORCE MOTORS LIMITED | 749 | 0.24% | 700 | 0.22% |
| JAGUAR LAND ROVER INDIA LIMITED | 433 | 0.14% | 267 | 0.08% |
| PCA AUTOMOBILES INDIA PVT LTD | 402 | 0.13% | 519 | 0.16% |
| FCA INDIA AUTOMOBILES PRIVATE LIMITED | 327 | 0.11% | 523 | 0.16% |
| BYD INDIA PRIVATE LIMITED | 209 | 0.07% | 104 | 0.03% |
| VOLVO AUTO INDIA PVT LTD | 104 | 0.03% | 160 | 0.05% |
| Others | 1,325 | 0.43% | 2,673 | 0.83% |
| Total | 3,09,053 | 100% | 3,23,720 | 100% |
Source: FADA Research
Disclaimer:
- The above numbers do not have figures from TS & LD.
- Vehicle Retail Data has been collated as on 03.09.24 in collaboration with Ministry of Road Transport & Highways, Government of India and has been gathered from 1,365 out of 1,429 RTOs.
| Tractor OEM | AUG’24 | Market Share (%) AUG’24 | AUG’23 | Market Share (%) AUG’23 |
| MAHINDRA & MAHINDRA LIMITED (TRACTOR) | 16,183 | 24.72% | 17,929 | 24.26% |
| MAHINDRA & MAHINDRA LIMITED (SWARAJ DIVISION) | 12,221 | 18.66% | 13,413 | 18.15% |
| INTERNATIONAL TRACTORS LIMITED | 8,495 | 12.97% | 8,458 | 11.45% |
| TAFE LIMITED | 7,119 | 10.87% | 9,564 | 12.94% |
| ESCORTS KUBOTA LIMITED (AGRI MACHINERY GROUP) | 5,869 | 8.96% | 7,433 | 10.06% |
| JOHN DEERE INDIA PVT LTD (TRACTOR DEVISION) | 5,313 | 8.11% | 4,900 | 6.63% |
| EICHER TRACTORS | 4,182 | 6.39% | 4,962 | 6.72% |
| CNH INDUSTRIAL (INDIA) PVT LTD | 2,550 | 3.89% | 2,383 | 3.22% |
| KUBOTA AGRICULTURAL MACHINERY INDIA PVT.LTD. | 1,222 | 1.87% | 1,506 | 2.04% |
| Others | 2,324 | 3.55% | 3,344 | 4.53% |
| Total | 65,478 | 100% | 73,892 | 100% |
Source: FADA Research
Disclaimer:
Vehicle Retail Data has been collated as on 03.09.24 in collaboration with Ministry of Road Transport & Highways, Government of India and has been gathered from 1,365 out of 1,429 RTOs.
The above numbers do not have figures from TS & LD.