
New Delhi, August 5, 2024 — The Federation of Automobile Dealers Associations (FADA) has released its vehicle retail data for July 2024, revealing significant growth across most segments, despite facing various challenges.
Double-Digit Growth in Auto Retail
The Indian auto retail sector recorded a year-on-year (YoY) growth of 13.84% in July 2024. The breakdown of the performance by segment is as follows:
- Two-Wheelers (2W): Achieved a robust growth of 17.17% YoY.
- Three-Wheelers (3W): Increased by 12.88% YoY.
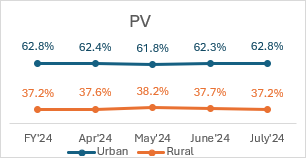
- Passenger Vehicles (PV): Saw a healthy rise of 10.18% YoY.
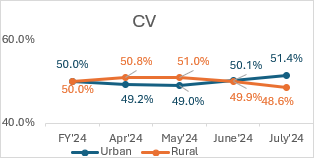
- Commercial Vehicles (CV): Grew by 5.93% YoY.
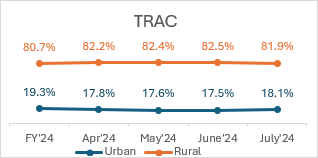
- Tractors (Trac): Experienced a significant decline of 11.95% YoY.
Segment Insights and Challenges
Two-Wheelers:
The two-wheeler segment benefited from a thriving rural economy, improved monsoon conditions, and government support programs. However, the segment faced challenges such as market slowdowns in certain regions, heavy rains, and increased competition. Notably, electric vehicle (EV) sales surged due to discounts and the EMPS scheme deadline.
Passenger Vehicles:
Passenger vehicle sales grew by 10%, driven by new model launches and attractive pricing strategies. Despite positive factors like good product availability and promotions, heavy rains, low consumer sentiment, and intense competition posed challenges. A critical concern is the historic high inventory levels, with stock worth Rs 73,000 crores, raising sustainability risks for dealers.
Commercial Vehicles:
The commercial vehicle segment saw a 6% YoY growth, supported by growth in construction and mining sectors. However, challenges such as continuous rainfall, negative rural sentiment, poor finance availability, and high vehicle prices affected the segment. Dealers leveraged small bulk deals and improved market reach to achieve growth.
Tractors:
The tractor segment underperformed, with a YoY decline of 12%. Factors contributing to this decline include uneven monsoon distribution and low consumer sentiment in rural areas.
Market Challenges and Near-Term Outlook
Monsoon Impact:
Above-normal cumulative rainfall with uneven distribution impacted regions differently. The Indian Meteorological Department (IMD) predicts ‘above normal’ rainfall in the second half of the monsoon season due to potential La Nina conditions. While excessive rains could lead to city flooding and landslides, they are crucial for Kharif sowing and standing crops.
Consumer Sentiment and Financial Strain:
Heavy rains and economic uncertainties have dampened consumer sentiment in some regions. High inventory levels in the PV segment have increased financial pressure on dealers, necessitating cautious inventory management and stringent financial checks.
Festive Season and Product Launches:
The upcoming festive season is expected to boost auto retail sales across segments. New product launches and ongoing promotions are likely to support future growth. However, dealers remain cautiously optimistic due to concerns over low customer inquiries and potential impacts of heavy rains.
Survey Findings
FADA conducted an online survey among its members, revealing mixed sentiments:
- Liquidity:
- Neutral: 50.22%
- Good: 25.97%
- Bad: 23.81%
- Sentiment:
- Neutral: 45.89%
- Good: 29.87%
- Bad: 24.24%
- Expectations for August 2024:
- Growth: 51.08%
- Bad: 38.10%
- De-growth: 10.82%
The Indian auto retail sector is navigating through a complex landscape of growth and challenges. While the positive impacts of the monsoon and the festive season provide optimism, effective inventory management and financial prudence are essential to sustain growth and ensure the sector’s stability.
All India Vehicle Retail Data for July’24
| CATEGORY | JULY’24 | JUNE’24 | JULY’23 | MoM % | YoY % |
| 2W | 14,43,463 | 13,75,889 | 12,31,930 | 4.91% | 17.17% |
| 3W | 1,10,497 | 94,321 | 97,891 | 17.15% | 12.88% |
| E-RICKSHAW(P) | 44,447 | 37,963 | 43,529 | 17.08% | 2.11% |
| E-RICKSHAW WITH CART (G) | 5,186 | 4,612 | 2,778 | 12.45% | 86.68% |
| THREE-WHEELER (GOODS) | 10,187 | 8,959 | 9,642 | 13.71% | 5.65% |
| THREE-WHEELER (PASSENGER) | 50,594 | 42,690 | 41,867 | 18.51% | 20.84% |
| THREE-WHEELER (PERSONAL) | 83 | 97 | 75 | -14.43% | 10.67% |
| PV | 3,20,129 | 2,81,566 | 2,90,564 | 13.70% | 10.18% |
| TRAC | 79,970 | 71,029 | 90,821 | 12.59% | -11.95% |
| CV | 80,057 | 72,747 | 75,573 | 10.05% | 5.93% |
| LCV | 45,336 | 40,711 | 44,428 | 11.36% | 2.04% |
| MCV | 7,124 | 6,872 | 6,509 | 3.67% | 9.45% |
| HCV | 24,066 | 21,546 | 21,525 | 11.70% | 11.80% |
| Others | 3,531 | 3,618 | 3,111 | -2.40% | 13.50% |
| Total | 20,34,116 | 18,95,552 | 17,86,779 | 7.31% | 13.84% |
Source: FADA Research
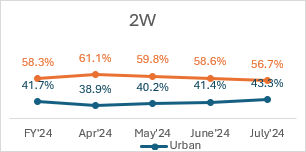
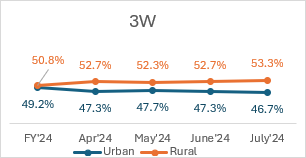
| Urban | Rural | |||
| CATEGORY | MoM% | YOY% | MoM% | YOY% |
| 2W | 4.47% | -1.74% | -3.16% | 1.36% |
| 3W | -1.37% | -6.25% | 1.23% | 6.20% |
| CV | 2.59% | 2.17% | -2.61% | -2.19% |
| PV | 0.74% | -3.76% | -1.22% | 7.05% |
| TRAC | 3.23% | -17.19% | -0.68% | 4.79% |
| Total | 3.61% | -2.29% | -2.87% | 2.02% |
Source: FADA Research
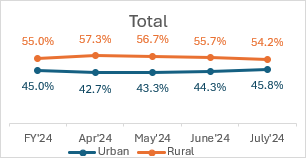
All India Vehicle Retail Strength Index for July’24 on basis of Urban & Rural RTOs.
Motor Vehicle Road Tax Collection (in Rs Crore)
| Julu’24 | June’24 | July’23 | MoM% | YoY% | |
| Motor Vehicle Road Tax Collection | 6,995 | 6,046 | 6046 | 15.7% | 15.7% |
Source: FADA Research
OEM wise Market Share Data for the Month of July’24 with YoY comparison
| Two-Wheeler OEM | JULY’24 | Market Share (%) JULY’24 | JULY’23 | Market Share (%) JULY’23 |
| HERO MOTOCORP LTD | 3,99,324 | 27.66% | 3,61,766 | 29.37% |
| HONDA MOTORCYCLE AND SCOOTER INDIA (P) LTD | 3,68,753 | 25.55% | 2,99,790 | 24.33% |
| TVS MOTOR COMPANY LTD | 2,51,140 | 17.40% | 2,13,628 | 17.34% |
| BAJAJ AUTO GROUP | 1,61,435 | 11.18% | 1,46,633 | 11.90% |
| BAJAJ AUTO LTD | 1,61,435 | 11.18% | 1,46,630 | 11.90% |
| CHETAK TECHNOLOGY LIMITED | – | 0.00% | 3 | 0.00% |
| SUZUKI MOTORCYCLE INDIA PVT LTD | 79,796 | 5.53% | 62,755 | 5.09% |
| ROYAL-ENFIELD (UNIT OF EICHER LTD) | 57,325 | 3.97% | 56,328 | 4.57% |
| INDIA YAMAHA MOTOR PVT LTD | 54,622 | 3.78% | 45,859 | 3.72% |
| OLA ELECTRIC TECHNOLOGIES PVT LTD | 41,624 | 2.88% | 19,406 | 1.58% |
| ATHER ENERGY PVT LTD | 10,087 | 0.70% | 6,685 | 0.54% |
| GREAVES ELECTRIC MOBILITY PVT LTD | 3,154 | 0.22% | 2,159 | 0.18% |
| PIAGGIO VEHICLES PVT LTD | 3,026 | 0.21% | 2,694 | 0.22% |
| CLASSIC LEGENDS PVT LTD | 2,131 | 0.15% | 2,188 | 0.18% |
| BGAUSS AUTO PRIVATE LIMITED | 1,792 | 0.12% | 661 | 0.05% |
| Others Including EV | 9,254 | 0.64% | 11,378 | 0.92% |
| Total | 14,43,463 | 100% | 12,31,930 | 100% |
Source: FADA Research
Disclaimer:
- The above numbers do not have figures from TS & LD.
- Vehicle Retail Data has been collated as on 03.08.24 in collaboration with Ministry of Road Transport & Highways, Government of India and has been gathered from 1,568 out of 1,645 RTOs.
- Others include OEMs accounting less than 0.1% Market Share.
| Three-Wheeler OEM | JULY’24 | Market Share (%) JULY’24 | JULY’23 | Market Share (%) JULY’23 |
| BAJAJ AUTO LTD | 38,728 | 35.05% | 34,104 | 34.84% |
| PIAGGIO VEHICLES PVT LTD | 8,439 | 7.64% | 7,950 | 8.12% |
| MAHINDRA & MAHINDRA LIMITED | 7,650 | 6.92% | 6,187 | 6.32% |
| MAHINDRA LAST MILE MOBILITY LTD | 7,545 | 6.83% | – | 0.00% |
| MAHINDRA & MAHINDRA LIMITED | 105 | 0.10% | 6,187 | 6.32% |
| MAHINDRA REVA ELECTRIC VEHICLES PVT LTD | – | 0.00% | – | 0.00% |
| YC ELECTRIC VEHICLE | 3,857 | 3.49% | 3,595 | 3.67% |
| SAERA ELECTRIC AUTO PVT LTD | 2,573 | 2.33% | 2,723 | 2.78% |
| ATUL AUTO LTD | 2,376 | 2.15% | 1,408 | 1.44% |
| DILLI ELECTRIC AUTO PVT LTD | 2,268 | 2.05% | 2,473 | 2.53% |
| TVS MOTOR COMPANY LTD | 1,981 | 1.79% | 1,377 | 1.41% |
| MINI METRO EV L.L.P | 1,433 | 1.30% | 1,568 | 1.60% |
| UNIQUE INTERNATIONAL | 1,340 | 1.21% | 1,301 | 1.33% |
| ENERGY ELECTRIC VEHICLES | 1,240 | 1.12% | 1,050 | 1.07% |
| HOTAGE INDIA | 1,205 | 1.09% | 1,246 | 1.27% |
| ALLFINE INDUSTRIES PVT LTD | 1,126 | 1.02% | 1,013 | 1.03% |
| Others including EV | 36,281 | 32.83% | 31,896 | 32.58% |
| Total | 1,10,497 | 100% | 97,891 | 100% |
Source: FADA Research
Disclaimer:
- The above numbers do not have figures from TS & LD.
- Vehicle Retail Data has been collated as on 03.08.24 in collaboration with Ministry of Road Transport & Highways, Government of India and has been gathered from 1,568 out of 1,645 RTOs.
- Others include OEMs accounting less than 1% Market Share.
| Commercial Vehicle OEM | JULY’24 | Market Share (%) JULY’24 | JULY’23 | Market Share (%) JULY’23 |
| TATA MOTORS LTD | 27,492 | 34.34% | 27,379 | 36.23% |
| MAHINDRA & MAHINDRA LIMITED | 19,023 | 23.76% | 17,637 | 23.34% |
| ASHOK LEYLAND LTD | 13,914 | 17.38% | 12,380 | 16.38% |
| VE COMMERCIAL VEHICLES LTD | 6,607 | 8.25% | 5,515 | 7.30% |
| MARUTI SUZUKI INDIA LTD | 3,519 | 4.40% | 3,362 | 4.45% |
| FORCE MOTORS LIMITED | 1,866 | 2.33% | 1,711 | 2.26% |
| DAIMLER INDIA COMMERCIAL VEHICLES PVT. LTD | 1,576 | 1.97% | 1,502 | 1.99% |
| SML ISUZU LTD | 1,252 | 1.56% | 1,136 | 1.50% |
| Others | 4,808 | 6.01% | 4,951 | 6.55% |
| Total | 80,057 | 100.00% | 75,573 | 100.00% |
Source: FADA Research
Disclaimer:
- The above numbers do not have figures from TS & LD.
- Vehicle Retail Data has been collated as on 03.08.24 in collaboration with Ministry of Road Transport & Highways, Government of India and has been gathered from 1,568 out of 1,645 RTOs.
| PV OEM | JULY’24 | Market Share (%) JULY’24 | JULY’23 | Market Share (%) JULY’23 |
| MARUTI SUZUKI INDIA LTD | 1,29,177 | 40.35% | 1,19,127 | 41.00% |
| TATA MOTORS LTD | 43,422 | 13.56% | 39,630 | 13.64% |
| HYUNDAI MOTOR INDIA LTD | 43,000 | 13.43% | 41,917 | 14.43% |
| MAHINDRA & MAHINDRA LIMITED | 37,854 | 11.82% | 29,954 | 10.31% |
| TOYOTA KIRLOSKAR MOTOR PVT LTD | 21,182 | 6.62% | 16,191 | 5.57% |
| KIA INDIA PRIVATE LIMITED | 18,682 | 5.84% | 14,737 | 5.07% |
| SKODA AUTO VOLKSWAGEN GROUP | 6,203 | 1.94% | 7,272 | 2.50% |
| SKODA AUTO VOLKSWAGEN INDIA PVT LTD | 6,154 | 1.92% | 7,153 | 2.46% |
| VOLKSWAGEN AG/INDIA PVT. LTD. | – | 0.00% | 1 | 0.00% |
| AUDI AG | 44 | 0.01% | 116 | 0.04% |
| SKODA AUTO INDIA/AS PVT LTD | 5 | 0.00% | 2 | 0.00% |
| HONDA CARS INDIA LTD | 4,809 | 1.50% | 4,445 | 1.53% |
| MG MOTOR INDIA PVT LTD | 3,887 | 1.21% | 4,365 | 1.50% |
| RENAULT INDIA PVT LTD | 3,078 | 0.96% | 3,902 | 1.34% |
| NISSAN MOTOR INDIA PVT LTD | 1,819 | 0.57% | 1,994 | 0.69% |
| MERCEDES -BENZ GROUP | 1,195 | 0.37% | 1,085 | 0.37% |
| MERCEDES-BENZ INDIA PVT LTD | 1,115 | 0.35% | 957 | 0.33% |
| MERCEDES -BENZ AG | 72 | 0.02% | 125 | 0.04% |
| DAIMLER AG | 8 | 0.00% | 3 | 0.00% |
| BMW INDIA PVT LTD | 1,080 | 0.34% | 1,156 | 0.40% |
| FORCE MOTORS LIMITED | 931 | 0.29% | 603 | 0.21% |
| JAGUAR LAND ROVER INDIA LIMITED | 466 | 0.15% | 257 | 0.09% |
| PCA AUTOMOBILES INDIA PVT LTD | 447 | 0.14% | 671 | 0.23% |
| FCA INDIA AUTOMOBILES PRIVATE LIMITED | 342 | 0.11% | 529 | 0.18% |
| BYD INDIA PRIVATE LIMITED | 341 | 0.11% | 118 | 0.04% |
| VOLVO AUTO INDIA PVT LTD | 127 | 0.04% | 138 | 0.05% |
| Others | 2,087 | 0.65% | 2,473 | 0.85% |
| Total | 3,20,129 | 100% | 2,90,564 | 100% |
Source: FADA Research
Disclaimer:
- The above numbers do not have figures from TS & LD.
- Vehicle Retail Data has been collated as on 03.08.24 in collaboration with Ministry of Road Transport & Highways, Government of India and has been gathered from 1,568 out of 1,645 RTOs.
| Tractor OEM | JULY’24 | Market Share (%) JULY’24 | JULY’23 | Market Share (%) JULY’23 |
| MAHINDRA & MAHINDRA LIMITED (TRACTOR) | 18,422 | 23.04% | 20,914 | 23.03% |
| MAHINDRA & MAHINDRA LIMITED (SWARAJ DIVISION) | 16,265 | 20.34% | 16,383 | 18.04% |
| INTERNATIONAL TRACTORS LIMITED | 11,141 | 13.93% | 11,063 | 12.18% |
| ESCORTS KUBOTA LIMITED (AGRI MACHINERY GROUP) | 8,274 | 10.35% | 8,534 | 9.40% |
| TAFE LIMITED | 7,884 | 9.86% | 12,420 | 13.68% |
| JOHN DEERE INDIA PVT LTD (TRACTOR DEVISION) | 6,251 | 7.82% | 5,529 | 6.09% |
| EICHER TRACTORS | 5,420 | 6.78% | 6,796 | 7.48% |
| CNH INDUSTRIAL (INDIA) PVT LTD | 3,018 | 3.77% | 3,191 | 3.51% |
| KUBOTA AGRICULTURAL MACHINERY INDIA PVT.LTD. | 1,461 | 1.83% | 1,876 | 2.07% |
| Others | 1,834 | 2.29% | 4,115 | 4.53% |
| Total | 79,970 | 100% | 90,821 | 100% |
Source: FADA Research
Disclaimer:
Vehicle Retail Data has been collated as on 03.08.24 in collaboration with Ministry of Road Transport & Highways, Government of India and has been gathered from 1,568 out of 1,645 RTOs.
The above numbers do not have figures from TS & LD.